Medical Image of the Week: ECG in PE
 Wednesday, January 7, 2015 at 8:00AM
Figure 1. ECG on presentation demonstrating sinus tachycardia, anterior precordial T wave inversions and S1Q3T3, classic ECG findings of pulmonary embolism.

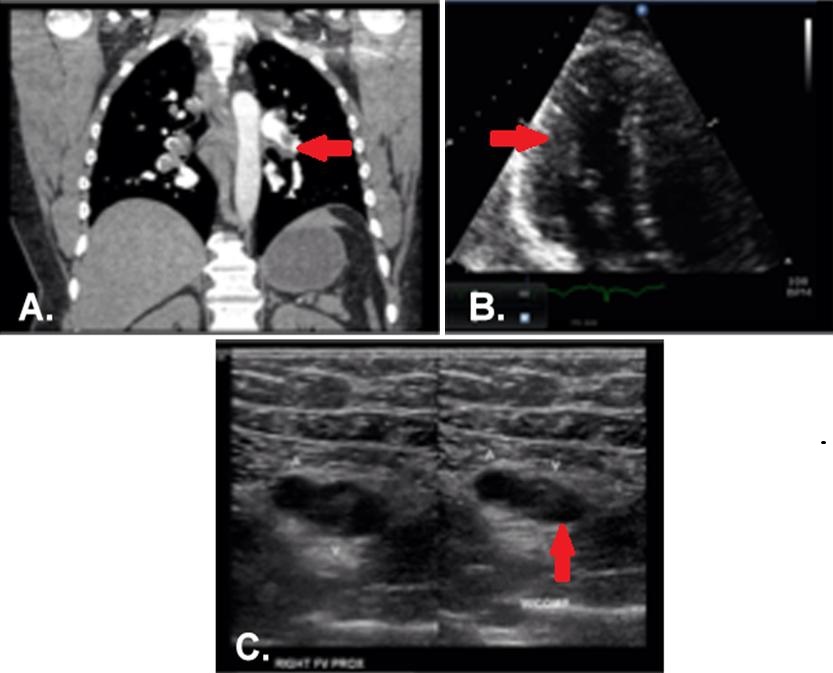
Figure 2. Panel A: CT angiogram demonstrating bilateral pulmonary embolism involving nearly every segmental and subsegmental pulmonary artery. Panel B: Echocardiogram, apical 4-chamber view, with dilated right ventricle and poor function. Panel C: Right leg ultrasound showing acute, non-occlusive thrombus; the right side of the image demonstrates incompressibility of the right femoral vein.
A 44-year-old male long distance truck driver with no known medical history presented with intermittent episodes of dyspnea for the past 24 hours, and an episode of exertional syncope just prior to hospitalization. The patient complained of sharp severe chest pain and reports several week history of right leg swelling. Initial Electrocardiogram (ECG, Figure 1) shows sinus tachycardia and signs of right ventricular strain with an associated troponin elevation. CT pulmonary angiography confirmed bilateral, extensive pulmonary emboli (PE) (Figure 2A, arrow at left pulmonary artery embolus). An echocardiogram showed severe right ventricular systolic dysfunction (Figure 2B, arrow indicated RV). Duplex ultrasound of the right leg showed extensive, acute, non-occlusive thrombus (Figure 2C, arrow indicates clot failing to compress). The patient received an IVC filter due to substantial clot burden. A hypercoagulability workup was negative.
The ECG is part of the typical evaluation for syncope, chest pain and shortness of breath. Multiple studies evaluating the utility of the ECG in the diagnosis of PE have been conducted (1-3). One study in patients with suspected PE undergoing diagnostic testing found that only tachycardia and incomplete right bundle branch block were significantly more prevalent in patients with PE than those without. Another study found a 39% rate of sinus tachycardia in those ultimately found to have PE compared to 24% in those who had negative studies. The S1Q3T3 phenomenon was present in 12% of those with PE vs 3% in those without. One or more traditional findings of right ventricular strain: S1Q3T3, right bundle branch block, or right axis deviation was present in only 13% of patients with PE who had RV dilation on echocardiography, however these findings were also present in 8.8% of patients with PE without evidence of RV dysfunction. Non-specific ECG findings such as sinus tachycardia and ST-T changes are the most commonly identified ECG abnormalities in patients with PE. Overall the ECG as a test for PE exhibits poor test characteristics and thus has little clinical utility for its diagnosis, despite the frequent emphasis on these findings in medical education.
Our patient’s ECG demonstrates several classic findings suggestive of PE including sinus tachycardia, S1Q3T3, and T-wave inversions in the anterior precordial leads. While certain ECG findings do correlate with the presence of PE they are frequently present in patients without PE and absent in those with the disease. ECG may have some utility in risk stratification by identifying signs of right heart strain, however echocardiography is the preferred modality.
Taylor Shekell MD2, Cameron Hypes MD MPH1,2, Yuval Raz MD1
1 Department of Medicine, Division of Pulmonary, Allergy, Critical Care, and Sleep Medicine
2 Department of Emergency Medicine
University of Arizona Medical Center
Tucson, AZ
References
- Rodger M, Makropoulos D, Turek M, Quevillon J, Raymond F, Rasuli P, Wells PS. Diagnostic value of the electrocardiogram in suspected pulmonary embolism. Am J Cardiol. 2000;86:807-9. [CrossRef] [PubMed]
- Sinha N, Yalamanchili K, Sukhija R, Aronow WS, Fleisher AG, Maguire GP, Lehrman SG. Role of the 12-lead electrocardiogram in diagnosing pulmonary embolism. Cardiol Rev. 2005;13:46-9. [PubMed]
- Stein P, Matta F, Sabra M, et al. Relation of electrocardiographic changes in pulmonary embolism to right ventricular enlargement. Am J Cardiol. 2013;112:1958-61. [CrossRef] [PubMed]
Reference as: Shekell T, Hypes C, Raz Y. Medical image of the week: ECG in PE. Southwest J Pulm Crit Care. 2015;10(1):44-6. doi: http://dx.doi.org/10.13175/swjpcc162-14 PDF

Reader Comments