Search Journal-type in search term and press enter
Southwest Pulmonary and Critical Care Fellowships
In Memoriam

General Medicine

(Most recent listed first. Click on title to be directed to the manuscript.)

Point-of-Care Ultrasound Bootcamp Training: A Pilot Program for
   Internal Medicine Residency
Infectious Diseases Telemedicine to the Arizona Department of Corrections
   During SARS-CoV-2 Pandemic. A Short Report. 
The Potential Dangers of Quality Assurance, Physician Credentialing and
   Solutions for Their Improvement (Review)
Results of the SWJPCC Healthcare Survey
Who Are the Medically Poor and Who Will Care for Them?
Tacrolimus-Associated Diabetic Ketoacidosis: A Case Report and Literature
   Review
Nursing Magnet Hospitals Have Better CMS Hospital Compare Ratings
Publish or Perish: Tools for Survival
Is Quality of Healthcare Improving in the US?
Survey Shows Support for the Hospital Executive Compensation Act
The Disruptive Administrator: Tread with Care
A Qualitative Systematic Review of the Professionalization of the 
   Vice Chair for Education
Nurse Practitioners' Substitution for Physicians
National Health Expenditures: The Past, Present, Future and Solutions
Credibility and (Dis)Use of Feedback to Inform Teaching : A Qualitative
   Case Study of Physician-Faculty Perspectives
Special Article: Physician Burnout-The Experience of Three Physicians
Brief Review: Dangers of the Electronic Medical Record
Finding a Mentor: The Complete Examination of an Online Academic
   Matchmaking Tool for Physician-Faculty
Make Your Own Mistakes
Professionalism: Capacity, Empathy, Humility and Overall Attitude
Professionalism: Secondary Goals 
Professionalism: Definition and Qualities
Professionalism: Introduction
The Unfulfilled Promise of the Quality Movement
A Comparison Between Hospital Rankings and Outcomes Data
Profiles in Medical Courage: John Snow and the Courage of
Conviction
Comparisons between Medicare Mortality, Readmission and 
Complications
In Vitro Versus In Vivo Culture Sensitivities:
An Unchecked Assumption?
Profiles in Medical Courage: Thomas Kummet and the Courage to
Fight Bureaucracy
Profiles in Medical Courage: The Courage to Serve
and Jamie Garcia
Profiles in Medical Courage: Women’s Rights and Sima Samar
Profiles in Medical Courage: Causation and Austin Bradford Hill
Profiles in Medical Courage: Evidence-Based 
Medicine and Archie Cochrane
Profiles of Medical Courage: The Courage to Experiment and 
Barry Marshall
Profiles in Medical Courage: Joseph Goldberger,
the Sharecropper’s Plague, Science and Prejudice
Profiles in Medical Courage: Peter Wilmshurst,
the Physician Fugitive
Correlation between Patient Outcomes and Clinical Costs
in the VA Healthcare System
Profiles in Medical Courage: Of Mice, Maggots 
and Steve Klotz
Profiles in Medical Courage: Michael Wilkins
and the Willowbrook School
Relationship Between The Veterans Healthcare Administration
Hospital Performance Measures And Outcomes 


Although the Southwest Journal of Pulmonary, Critical Care & Sleep was started as a pulmonary/critical care/sleep journal, we have received and continue to receive submissions that are of general medical interest. For this reason, a new section entitled General Medicine was created on 3/14/12. Some articles were moved from pulmonary to this new section since it was felt they fit better into this category.

-------------------------------------------------------------------------------------

Entries in CMS (4)

Thursday
Dec052019

Who Are the Medically Poor and Who Will Care for Them?

Richard A. Robbins, MD

Phoenix Pulmonary and Critical Care Research and Education Foundation

Gilbert, AZ USA


Introduction

A fundamental healthcare question has been raised in the ongoing Presidential political debates-who will provide healthcare for the poor? Some are advocating “Medicare for All” while others offer other solutions. Regardless, it appears that no one is providing adequate healthcare at the moment. Go back about 60 years and there were a number of excellent public hospitals-Bellevue in New York, Cook County in Chicago, LA County in Los Angeles, Grady in Atlanta, and the aptly named Charity in New Orleans to name a few. Most were affiliated with medical schools and staffed by the medical school staff, residents and students. The poor generally received good care in those hospitals. It has long been known that academically affiliated hospitals have the best outcomes which was recently confirmed by a study from Burke et al. (1).

However, there has been some suggestion that these public (charity) hospitals might not be providing the best care to everyone. Sporadic reports have been received of patients being unable to get their breast cancer resected, not being worked up for cancer, and unable to get expensive medications, such as monoclonal antibodies for immunotherapy. This is due to lack of insurance, or denial by the insurance company or inability to afford co-payments or deductibles. What do these patients have in common? -they  are un- or under-insured, or in other words, medically poor. Apparently, the “hyperfinancializaton” of healthcare has resulted in patients with no or too little insurance unable to receive life-sustaining and appropriate care, even at a public hospital. Government was the answer in the past. Most of the large charity hospitals were locally or state funded, but with the introduction of Medicare and Medicaid in the early 1960’s, the responsibility shifted toward the Federal government. Local financial support waned as the Federal support increased (2).

The Underinsured

Of the 194 million U.S. adults ages 19 to 64, an estimated 87 million, or 45 percent, are inadequately insured (3). This is based on a definition of underinsured if the patient’s:

  • out-of-pocket costs, excluding premiums, over the prior 12 months are equal to 10 percent or more of household income; or
  • out-of-pocket costs, excluding premiums, over the prior 12 months are equal to 5 percent or more of household income for individuals living under 200 percent of the federal poverty level ($24,120 for an individual or $49,200 for a family of four); or
  • deductible medical costs constitute 5 percent or more of household income.

This is truly a staggering number. Given that 12% of the population is uninsured, the 45% underinsured means that over half of the population is  inadequately insured during their prime working years. They can only receive the care that they can pay for, or in other words, minimal care.

Trends

One result of the Affordable Care Act has been a decline in the Nation’s uninsured. The percentage of uninsured has fallen from 20% in 2010 to 12% in 2018 (3). There have also been shorter gaps in patients’ coverage when they lose their insurance (3). However, the bad news is that more patients are underinsured. Of people who were insured continuously throughout 2018, an estimated 44 million were underinsured because of high out-of-pocket costs and deductibles. This is up from an estimated 29 million in 2010. One group likely to be underinsured is not surprisingly people who buy plans on their own through the individual market including the marketplaces. However, the greatest growth in the number of underinsured adults over this 2010-2018 period has occurred among those in employer health plans (3). These plans are increasingly shifting costs to the insured often resulting in ridiculous high deductibles or other ruses to shift costs.

Who Are the Medically Poor?

Those that cannot pay their medical bills are the medically poor. Hospital costs are notoriously hard to nail down. However, in 2005 the average cost of 2 days in the intensive care unit (ICU) in the US was $44,505 (4). Bills for prolonged illnesses could easily reach several hundred thousand dollars. Most of us rely on insurance to pay for these costs but even a percentage of the copayments may be extraordinarily high. What if the insurance decides not to pay for some reason such as the hospital is out of network, the doctors are out of network, or some other often nebulous reason? Jeff Bezos and Bill Gates are probably safe, however, what about the rest of us? In a controversial article, Sen. Elizabeth Warren and coauthors point out that medical costs significantly contribute to 60% of bankruptcies (5,6).

Personally, our family would have difficulty paying several hundred thousand dollars. We lately had a taste of this when a family member was scheduled to have a parotid tumor removed. After assuring us that the operation was covered by our insurance, the hospital where the scheduled surgery was to take place demanded $14,000 up front on the day of the operation. Fortunately, this was an elective surgery, and we were able to cancel the operation and reschedule at another hospital where the procedure was actually covered. But what if the operation was an emergency? Our family would have had little choice but to pay the money up front and then potentially be on the hook for hundreds of thousands of dollars.

Rural and Safety Net Hospitals

Recently, ProPublica ran a series on medical debt in the small rural town of Coffeyville, Kansas (7). The once bustling industrial center has suffered the plight of so many rural towns with a deteriorating economic base, declining population and a poverty rate more than double the national average. ProPublica points out that Coffeyville has a medical debt collection system where the judge has no law degree, debt collectors get a cut of the debt collection, and the medically poor can potentially be imprisoned for failing to pay their medical debts. This is probably not what community leaders envisioned when they founded the Coffeyville Regional Medical Center in 1949 and charged it with the mission “…to serve our patients and families with the highest quality healthcare”.

The ProPublica article also points out the other side of the story. The local hospital has $1.5 million in uncollected debt and the local ambulance service operates at a loss of over $300,000 per year. Most of the other small-town hospitals and ambulance services surrounding Coffeyville have closed. Nevertheless, the hospital seemed to be handling these losses until the Centers for Medicare and Medicaid Services (CMS) cut the hospital’s reimbursement by $1.4 million or about the same as the hospital’s bad debt (8). A majority of the cuts the Coffeyville Regional Medical Center come from the Trump’s administration cancellation of the Low-volume Adjustment Program for Rural Hospitals. This resulted in the hospital cutting about 30 positions mostly through attrition.

Coffeyville is not the only town with a medical center facing financial hardship. Many of the large urban medical centers mentioned earlier are “safety-net hospitals” and have also been under increasing financial pressure (9). Unfortunately, reimbursement from the Federal government has been inconsistent and payment has been difficult to predict under shifting economic and political forces.

Hyperfinancializaton

There was a time when certain aspects of society were not expected to make a profit including schools, utilities, and hospitals. It was realized that each fulfilled a special societal need. Hospitals and schools operate as not-for-profit, tax-exempt entities because of their commitment to educate and care for the public. Here in Arizona the electric companies are under the auspices of the Arizona Corporation Commission who sets their rates. However, under increasing pressure from declining tax revenues, many governments have shifted the cost burden of education, electrical power and healthcare to the private sector. With privatization comes the problem that some customers without the resources to pay are “left out in the cold”. Nowhere has that been more obvious than in Arizona. Public schools struggle while public funds are rechanneled to private charter schools; universities raise tuition and close programs because they are not profitable; private utilities shut off air conditioning when the temperature is over 100° F; and sadly, hospitals deny needed care because neither they or the patient can afford it. Public hospitals who do not deal effectively with these fiscal realities face the very real prospect of going out of business.

Summary

We must ask ourselves who will pay for the care of the poor and other basic services if not government? The private sector has apparently not been the solution and blaming inefficient bureaucrats has become an over-used cliché that obscures the basic problem of lack of funding (10). Governments and hospitals are caught with insufficient resources to provide basic healthcare services. In healthcare, a profit-driven private sector has resulted in marked price increases and pays attention to the poor only when a third-party payer reimburses the cost of care. Regardless of the specifics, the last 50 years have demonstrated that any solution that does not involve adequate government funding will not meet the goal of caring for all. However, a tax base allowing sufficient resources needs to be established. Government was the solution in the past and will need to be solution in the future.

References

  1. Burke L, Khullar D, Orav EJ, Zheng J, Frakt A, Jha AK. Do academic medical centers disproportionately benefit the sickest patients? Health Aff (Millwood). 2018 Jun;37(6):864-872. [CrossRef] [PubMed]
  2. Gibson RM, Waldo DR. National health expenditures, 1980. Health Care Financing Review. September 1981. Available at: https://www.cms.gov/Research-Statistics-Data-and Systems/Research/HealthCareFinancingReview/Downloads/CMS1191799DL.pdf (accessed 10/26/19).
  3. Collins SR, Bhupal HK, Doty MM. Health insurance coverage eight years after the ACA-fewer uninsured Americans and shorter coverage gaps, but more underinsured. Commonwealth Fund. February 7, 2019. Available at: https://www.commonwealthfund.org/publications/issue-briefs/2019/feb/health-insurance-coverage-eight-years-after-aca (accessed 10-26-19).
  4. Dasta JF, McLaughlin TP, Mody SH, Piech CT. Daily cost of an intensive care unit day: the contribution of mechanical ventilation. Crit Care Med. 2005 Jun;33(6):1266-71. [CrossRef] [PubMed]
  5. Himmelstein DU, Warren E, Thorne D, Woolhandler S. Illness and injury as contributors to bankruptcy. Health Aff (Millwood). 2005 Jan-Jun;Suppl Web Exclusives:W5-63-W5-73. [CrossRef] [PubMed]
  6. Himmelstein DU, Thorne D, Warren E, Woolhandler S. Medical bankruptcy in the United States, 2007: results of a national study. Am J Med. 2009 Aug;122(8):741-6. [CrossRef] [PubMed]
  7. Presser L. When medical debt collectors decide who gets arrested. Propbulica. October 16, 2019. Available at: https://features.propublica.org/medical-debt/when-medical-debt-collectors-decide-who-gets-arrested-coffeyville-kansas/ (accessed 10/26/19).
  8. William A. Hospital faces $1.4 million in reimbursement cuts. The Independence Daily Reporter. January 13, 2018. Available at: https://indydailyreporter.com/Content/News/News/Article/Hospital-faces-1-4-million-in-reimbursement-cuts/1/98/27613 (accessed 10/26/19).
  9. Popescu I Fingar KR, Cutler E, Guo J, Jiang HJ. Comparison of 3 safety-net hospital definitions and association with hospital characteristics. JAMA Netw Open. 2019 Aug 2;2(8):e198577.[CrossRef] [PubMed]
  10. Milward H, Rainey H. Don't Blame the Bureaucracy! Journal of Public Policy. 1983;3(2):149168. [CrossRef]

Cite as: Robbins RA. Who are the medically poor and who will care for them? Southwest J Pulm Crit Care. 2019;19(6):158-62. doi: https://doi.org/10.13175/swjpcc069-19 PDF 


Saturday
Nov042017

Nursing Magnet Hospitals Have Better CMS Hospital Compare Ratings

Richard A. Robbins, MD

Phoenix Pulmonary and Critical Care Research and Education Foundation

Gilbert, AZ USA

Abstract

Background: There has been conflicting data on whether Nursing Magnet Hospitals (NMH) provide better care.

Methods: NMH in the Southwest USA (Arizona, California, Colorado, Hawaii, Nevada, and New Mexico) were compared to hospitals not designated as NMH using the Centers for Medicare and Medicaid (CMS) hospital compare star designation.

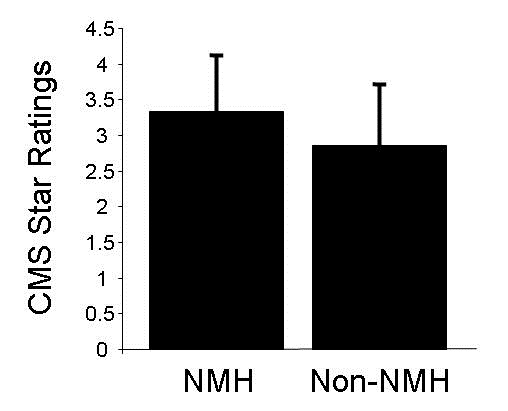
Results: NMH had higher star ratings than non-NMH hospitals (3.34 + 0.78 vs. 2.86 + 0.83, p<0.001). The hospitals were mostly large, urban non-critical access hospitals. Academic medical centers made up a disproportionately large portion of the NMH.

Conclusions: Although NMH had higher hospital ratings, the data may favor non-critical access academic medical centers which are known to have better outcomes.

Introduction

Magnet status is awarded to hospitals that meet a set of criteria designed to measure nursing quality by the American Nurses' Credentialing Center (ANCC), a part of the American Nurses Association (ANA). The Magnet designation program was based on a 1983 ANA survey of 163 hospitals deriving its key principles from the hospitals that had the best nursing performance. The prime intention was to help hospitals and healthcare facilities attract and retain top nursing talent.

There is no consensus whether Magnet status has an impact on nurse retention or on clinical outcomes. Kelly et al. (1) found that NMH hospitals provide better work environments and a more highly educated nursing workforce than non-NMH. In contrast, Trinkoff et al. (2) found no significant difference in working conditions between NHM and non-NMH. To further confuse the picture, Goode et al. (3) reported that NMH generally had poorer outcomes.

The Centers for Medicare and Medicaid Services (CMS) has developed star ratings in an attempt to measure quality of care (4). The ratings are based on five broad categories: 1. Outcomes; 2. Intermediate Outcomes; 3. Patient Experience; 4. Access; and 5. Process. Outcomes and intermediate outcomes are weighted three times as much as process measures, and patient experience and access measures are weighted 1.5 times as much as process measures. The ratings are from 1-5 stars with higher numbers of stars indicating a higher quality rating.

This study compares the CMS star ratings between NMH and non-NMH in the Southwest USA (Arizona, California, Colorado, Hawaii, Nevada and New Mexico). The results demonstrate that NMH have higher CMS star ratings. However, the NMH have characteristics which have been previously associated with higher quality of care using some measures.

Methods

Nursing Magnet Hospitals

NMH were identified from The American Nurses Credentialing Center website (5).

CMS Star Ratings

Star ratings were obtained from the CMS website (4).

Statistics

Only when data was available for both NMH and CMS star ratings were the hospitals included. Data was expressed as mean + standard deviation.  NMH and non-NMH were compared using Student’s t test. Significance was defined as p<0.05.

Results

Hospital Characteristics

There were 44 NMH and 415 non-NMH hospitals in the data (see Appendix). California had the most hospitals (287) and the most NMH (28). Arizona had 8 NMH, Colorado 7 and Hawaii 1. Nevada and New Mexico had none. All the NMH were acute care hospitals located in major metropolitan areas. Most were larger hospitals. None were designated critical access hospitals by CMS. Eleven of the NMH were the primary teaching hospitals for medical schools. Many of the others had affiliated teaching programs.

CMS Star Ratings

The CMS star ratings were higher for NMH than non NMH (3.34 + 0.78 vs. 2.86 + 0.83, p<0.001, Figure 1).

Figure 1. CMS star ratings for Nurse Magnet Hospitals (NMH) and non-NMH (p<0.001).

Discussion

The present study shows that for hospitals in the Southwest, NMH had higher CMS star ratings than non-NMH. This is consistent with better levels of care in NMH than non-NMH. However, the NMH were large, urban, non-critical access medical centers which were disproportionately academic medical centers. Previous studies have shown that these hospitals have better outcomes (6,7).

There seems to be little consensus in the literature regarding patient outcomes in NMH. A 2010 study concluded that non-NMH actually had better patient outcomes than NMH (3). Similarly, studies published early in this decade suggested little difference in outcomes (1,2). In contrast, a more recent study suggested improvements in patient outcomes in NMH (8). The present study supports the concept that NMH status might be a marker for better patient outcomes.

Achieving NMH status is expensive. Hospitals pay about $2 million for initial NMH certification, and pay nearly the same amount for re-certification every 4 years. It seems unlikely that small rural hospitals could afford the fee to achieve and maintain NMH regardless of their quality of care. Therefore, the NMH would be expected to be larger, urban medical centers which were the results found in the present study.

Despite there being no direct link of NMH to reimbursement, a study by the Robert Wood Johnson Foundation suggests that achieving NMH status increased hospital revenue (9). On average, NMH received an adjusted net increase in inpatient income of about $104 to $127 per discharge after earning Magnet status, amounting to about $1.2 million in revenue each year. The reason(s) for the improvement in hospital fiscal status are unclear.

Measuring quality of care is quite complex. The CMS star ratings are an attempt to summarize the quality of care using 5 broad categories: 1. Outcomes; 2. Intermediate Outcomes; 3. Patient Experience; 4. Access; and 5. Process. There are up to 32 measures in each category. Outcomes, patient experience and access seem relatively straight-forward. An example of a secondary outcome is control of blood pressure because of its link to outcomes. Examples of process measures include colorectal cancer screening, annual flu shot and monitoring physical activity. To further complicate the CMS ratings, each category is weighted.

It is possible that the CMS star ratings might miss or under weigh a key element in quality of care. For example, Needleman et al. (10) has emphasized that increased registered nurse staffing reduces hospital mortality. However, a 2011 study concluded that NMH had less total staff and a lower RN skill mix compared with non-NMH hospitals contributing to poorer outcomes (3).

The present study supports the concept that achieving NMH status is associated with better care as defined by CMS. However, given the complexities of measuring quality of care it is unclear whether this represents a marker of better hospitals or if the process of achieving NMH leads to better care.

References

  1. Kelly LA, McHugh MD, Aiken LH. Nurse outcomes in Magnet® and non-Magnet hospitals. J Nurs Adm. 2012 Oct;42(10 Suppl):S44-9. [PubMed]
  2. Trinkoff AM, Johantgen M, Storr CL, Han K, Liang Y, Gurses AP, Hopkinson S. A comparison of working conditions among nurses in Magnet and non-Magnet hospitals. J Nurs Adm. 2010 Jul-Aug;40(7-8):309-15. [CrossRef] [PubMed]
  3. Goode CJ, Blegen MA, Park SH, Vaughn T, Spetz J. Comparison of patient outcomes in Magnet® and non-Magnet hospitals. J Nurs Adm. 2011 Dec;41(12):517-23. [CrossRef] [PubMed]
  4. Centers for Medicare and Medicaid. 2017 star ratings. Available at: https://www.cms.gov/Newsroom/MediaReleaseDatabase/Fact-sheets/2016-Fact-sheets-items/2016-10-12.html (accessed 10/15/17).
  5. The American Nurses Credentialing Center. ANCC List of Magnet® Recognized Hospitals. Available at: http://www.clinicalmanagementconsultants.com/ancc-list-of-magnet-recognized-hospitals--cid-4457.html (accessed 10/15/17).
  6. Burke LG, Frakt AB, Khullar D, Orav EJ, Jha AK. Association Between Teaching Status and Mortality in US Hospitals. JAMA. 2017 May 23;317(20):2105-13. [CrossRef] [PubMed]
  7. Joynt KE, Harris Y, Orav EJ, Jha AK. Quality of care and patient outcomes in critical access rural hospitals. JAMA. 2011 Jul 6;306(1):45-52. [CrossRef] [PubMed]
  8. Friese CR, Xia R, Ghaferi A, Birkmeyer JD, Banerjee M. Hospitals in 'Magnet' program show better patient outcomes on mortality measures compared to non-'Magnet' hospitals. Health Aff (Millwood). 2015 Jun;34(6):986-92. [CrossRef] [PubMed]
  9. Jayawardhana J, Welton JM, Lindrooth RC. Is there a business case for magnet hospitals? Estimates of the cost and revenue implications of becoming a magnet. Med Care. 2014 May;52(5):400-6. [CrossRef] [PubMed]
  10. Needleman J, Buerhaus P, Pankratz VS, Leibson CL, Stevens SR, Harris M. Nurse staffing and inpatient hospital mortality. N Engl J Med. 2011 Mar 17;364(11):1037-45.[CrossRef] [PubMed]

Cite as: Robbins RA. Nursing magnet hospitals have better CMS hospital compare ratings. Southwest J Pulm Crit Care. 2017;15(5):209-13. doi: https://doi.org/10.13175/swjpcc128-17 PDF 

Monday
Sep232013

A Comparison Between Hospital Rankings and Outcomes Data

Richard A. Robbins, MD*

Richard D. Gerkin, MD  


*Phoenix Pulmonary and Critical Care Research and Education Foundation, Gilbert, AZ

Banner Good Samaritan Medical Center, Phoenix, AZ


Abstract

Hospital rankings have become common but the agreement between the rankings and correlation with patient-centered outcomes remains unknown. We examined the ratings of Joint Commission on Healthcare Organizations (JCAHO), Leapfrog, and US News and World Report (USNews), and outcomes from Centers for Medicare and Medicaid Hospital Compare (CMS) for agreement and correlation. There was some correlation among the three “best hospitals” ratings.  There was also some correlation between “best hospitals” and CMS outcomes, but often in a negative direction.  These data suggest that no one “best hospital” list identifies hospitals that consistently attain better outcomes.

Introduction

Hospital rankings are being published by a variety of organizations. These rankings are used by hospitals to market the quality of their services. Although all the rankings hope to identify “best” hospitals, they differ in methodology. Some emphasize surrogate markers; some emphasize safety, i.e., a lack of complications; some factor in the hospital’s reputation; some factor in patient-centered outcomes.  However, most do not emphasize traditional outcome measures such as mortality, mortality, length of stay and readmission rates. None factor cost or expenditures on patient care.

We examined three common hospital rankings and clinical outcomes. We reasoned that if the rankings are valid then better hospitals should be consistently on these best hospital lists. In addition, better hospitals should have better outcomes.

Methods

CMS

Outcomes data was obtained from the CMS Hospital Compare website from December 2012-January 2013 (1). The CMS website presents data on three diseases, myocardial infarction (MI), congestive heart failure (CHF) and pneumonia. We examined readmissions, complications and deaths for each of these diseases. We did not examine all process of care measures since many of the measures have not been shown to correlate with improved outcomes and patient satisfaction has been shown to correlate with higher admission rates to the hospital, higher overall health care expenditures, and increased mortality (2). In some instances actual data is not presented on the CMS website but only higher, lower or no different from the National average. In this case, scoring was done 2, 0 and 1 respectively with 2=higher, 0=lower and 1=no different.

Mortality is the 30-day estimates of deaths from any cause within 30 days of a hospital admission, for patients hospitalized with one of several primary diagnoses (MI, CHF, and pneumonia). Mortality was reported regardless of whether the patient died while still in the hospital or after discharge. Similarly, the readmission rates are 30-day estimates of readmission for any cause to any acute care hospital within 30 days of discharge. The mortality and readmission measures rates were adjusted for patient characteristics including the patient’s age, gender, past medical history, and other diseases or conditions (comorbidities) the patient had at hospital arrival that are known to increase the patient’s risk of dying or readmission.

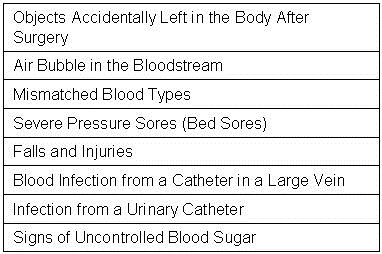
The rates of a number of complications are also listed in the CMS data base (Table 1).

Table 1. Complications examined that are listed in CMS data base.

CMS calculates the rate for each serious complication by dividing the actual number of outcomes at each hospital by the number of eligible discharges for that measure at each hospital, multiplied by 1,000. The composite value reported on Hospital Compare is the weighted averages of the component indicators.  The measures of serious complications reported are risk adjusted to account for differences in hospital patients’ characteristics. In addition, the rates reported on Hospital Compare are “smoothed” to reflect the fact that measures for small hospitals are measured less accurately (i.e., are less reliable) than for larger hospitals.

Similar to serious infections, CMS calculates the hospital acquired infection data from the claims hospitals submitted to Medicare. The rate for each hospital acquired infection measure is calculated by dividing the number of infections that occur within any given eligible hospital by the number of eligible Medicare discharges, multiplied by 1,000. The hospital acquired infection rates were not risk adjusted.

JCAHO

The JCAHO list of Top Performers on Key Quality Measures™ was obtained from its 2012 list (3). The Top Performers are based on an aggregation of accountability measure data reported to The JCAHO during the previous calendar year.

Leapfrog

Leapfrog’s Hospital Safety Score were obtained from their website during December 2012-January 2013 (4). The score utilizes 26 National performance measures from the Leapfrog Hospital Survey, the Agency for Healthcare Research and Quality (AHRQ), the Centers for Disease Control and Prevention (CDC), and the Centers for Medicare and Medicaid Services (CMS) to produce a single composite score that represents a hospital’s overall performance in keeping patients safe from preventable harm and medical errors. The measure set is divided into two domains: (1) Process/Structural Measures and (2) Outcome Measures. Many of the outcome measures are derived from the complications reported by CMS (Table 1). Each domain represents 50% of the Hospital Safety Score. The numerical safety score is then converted into one of five letter grades. "A" denotes the best hospital safety performance, followed in order by "B", "C", “D,” and “F.” For analysis, these letter grades were converted into numerical grades 1-5 corresponding to letter grades A-F.

US News and World Report

US News and World Report’s (USNews) 2012-3 listed 17 hospitals on their honor roll (5). The rankings are based largely on objective measures of hospital performance, such as patient survival rates, and structural resources, such as nurse staffing levels. Each hospital’s reputation, as determined by a survey of physician specialists, was also factored in the ranking methodology. The USNews top 50 cardiology and pulmonology hospitals were also examined.

Statistical Analysis

Categorical variables such as JCAHO and USNews best hospitals were compared with other data using chi-squared analysis. Spearman rank correlation was used to help determine the direction of the correlations (positive or negative). Significance was defined as p<0.05.

Results

Comparisons of Hospital Rankings between Organizations

A large database of nearly 3000 hospitals was compiled for each of the hospital ratings (Appendix 1). The “best hospitals” as rated by the JCAHO, Leapfrog and USNews were compared for correlation between the organizations (Table 2).

Table 2. Correlation of “best hospitals” between different organizations

There was significant correlation between the JCAHO and Leapfrog and Leapfrog and USNews but not between JCAHO and USNews.

JCAHO-Leapfrog Comparison

The Leapfrog grades were significantly better for JCAHO “Best Hospitals” compared to hospitals not listed as “Best Hospitals” (2.26 + 0.95  vs. 1.85 + 0.91, p<0.0001). However, there were multiple exceptions. For example, of the 358 JCAHO “Best Hospitals” with a Leapfrog grade, 84 were graded “C”, 11 were graded “D” and one was graded as “F”.

JCAHO-USNews Comparison

Of the JCAHO “Top Hospitals” only one was listed on the USNews “Honor Roll”. Of the cardiology and pulmonary “Top 50” hospitals only one and two hospitals, respectively, were listed on the JCAHO “Top Hospitals” list.

Leapfrog-USNews Comparison

The Leapfrog grades of the US News “Honor Roll” hospitals did not significantly differ compared to the those hospitals not listed on the “Honor Roll” (2.21 + 0.02 vs. 1.81 + 0.31, p>0.05). However, Leapfrog grades of the US News “Top 50 Cardiology” hospitals had better Leapfrog grades (2.21 +  0.02 vs. 1.92 + 0.14, p<0.05). Similarly, Leapfrog grades of the US News “Top 50 Pulmonary” hospitals had better Leapfrog grades (2.21 + 0.02 vs. 1.91 + 0.15, p<0.05).

“Best Hospital” Mortality, Readmission and Serious Complications

The data for the comparison between the hospital rankings and CMS’ readmission rates, mortality rates and serious complications for the JCAHO, Leapfrog, and USNews are shown in Appendix 2, Appendix 3, and Appendix 4 respectively. The results of the comparison of “best hospitals” compared to hospitals not listed as best hospitals are shown in Table 3.

Table 3. Results of “best hospitals” compared to other hospitals for mortality and readmission rates for myocardial infarction (MI), congestive heart failure (CHF) and pneumonia.

Red:  Relationship is concordant (better rankings associated with better outcomes)

Blue:  Relationship is discordant (better rankings associated with worse outcomes)

Note that of 21 total p values for relationships, 12 are non-significant, 6 are concordant and significant, and 6 are discordant and significant.  All 4 of the significant readmission relationships are discordant. All 5 of the significant mortality relationships are concordant. This underscores the disjunction of mortality and readmission. All 3 of the relationships with serious complications are significant, but one of these is discordant. Of the 3 ranking systems, Leapfrog has the least correlation with CMS outcomes (5/7 non-significant).  USNews has the best correlation with CMS outcomes (6/7 significant).  However, 3 of these 6 are discordant.

The USNews “Top 50” hospitals for cardiology and pulmonology were also compared to those hospitals not listed as “Top 50” hospitals for cardiology and pulmonology. Similar to the “Honor Roll” hospitals there was a significantly higher proportion of hospitals with better mortality rates for MI and CHF for the cardiology “Top 50” and for pneumonia for the pulmonary “Top 50”. Both the cardiology and pulmonary “Top 50” had better serious complication rates (p<0.05, both comparisons, data not shown).

Discussion

Lists of hospital rankings have become widespread but whether these rankings identify better hospitals is unclear. We reasoned that if the rankings were meaningful then there should be widespread agreement between the hospital lists. We did find a level of agreement but there were exceptions. Hospital rankings should correlate with patient-centered outcomes such as mortality and readmission rates. Overall that level of agreement was low.

One probable cause accounting for the differences in hospital rankings is the differing methodologies used in determined the rankings. For example, JCAHO uses an aggregation of accountability measures. Leapfrog emphasizes safety or a lack of complications. US News uses patient survival rates, structural resources, such as nurse staffing levels, and the hospital’s reputation. However, the exact methodolgical data used to formulate the rankings is often vague, especially for JCAHO and US News rankings. Therefore, it should not be surprising that the hospital rankings differ.

Another probable cause for the differing rankings is the use of selected complications in place of patient-centered outcome measures. Complications are most meaningful when they negatively affect ultimate patient outcomes. Some complications such as objects accidentally left in the body after surgery, air bubble in the bloodstream or mismatched blood types are undesirable but very infrequent. Whether a slight, but significant, increase in these complications would increase more global measures such as morality or readmission rates is unlikely. The overall poor correlation of these outcomes with deaths and readmissions in the CMS database is consistent with this concept.

Some of the surrogate complication rates are clearly evidence-based but some are clearly not. For example, many of the central-line associated infection and ventilator-associated pneumonia guidelines used are non-evidence based (6.7). Furthermore, overreaction to correct some of the complications such as “signs of uncontrolled blood sugar” may be potentially harmful. This complication could be interpreted as tight control of the blood sugar. Unfortunately, when rigorously studied, patients with tight glucose control actually had an increase in mortality (8).

In some instances a complication was associated with improved outcomes. Although the reason for this discordant correlation is unknown, it is possible that the complication may occur as a result of better care. For example, catherization of a central vein for rapid administration of fluids, drugs, blood products, etc. may result in better outcomes or quality but will increase the central line-associated bloodstream infection rate. In contrast, not inserting a catheter when appropriate might lead to worse outcomes or poorer quality but would improve the infection rate.

Many of the rankings are based, at least in part, on complication data self-reported by the hospitals to CMS. However, the accuracy of this data has been called into question (9,10). Meddings et al. (10) studied urinary tract infections which were self-reported by hospitals using claims data. According to Meddings (10), the data were “inaccurate” and not were “not valid data sets for comparing hospital acquired catheter-associated urinary tract infection rates for the purpose of public reporting or imposing financial incentives or penalties”. The authors proposed that the nonpayment by Medicare for “reasonably preventable” hospital-acquired complications resulted in this discrepancy. Inaccurate data may lead to the lack of correlation a complication and outcomes on the CMS database.

The sole source of mortality and readmission data in this study was CMS. This is limited to Medicare and Medicaid patients but is probably representative of the general population in an acute care hospital. However, also included on the CMS website is a dizzying array of measures. We did not analyze every measure but analyzed only those listed in Table 1. Whether examination of other measures would correlate with mortality and readmission rates is unclear.

There are several limitations to our data. First and foremost, the CMS data is self-reported by hospitals. The validity and accuracy of the data has been called into question. Second, data is missing in multiple instances. For example, much of the data from Maryland was not present. Also, there were multiple instances when the data was “unavailable” or the “number of cases are too small”.  Third, in some instances CMS did not report actual data but only higher, lower or no different from the National average. This loss of information may have led to inaccurate analyses. Fourth, much of the data are from surrogate markers, a fact which is important since surrogate markers have not been shown to predict outcomes. This is also puzzling since patient-centered outcomes are available.  Fifth, much of the outcomes data is derived from CMS which to a large extent eliminates Veterans Administration, pediatric, mental health and some other specialty facilities.

It is unclear if any of the hospital rankings should be used by patients or healthcare providers when choosing a hospital. At present it would appear that the rankings have an over reliance on surrogate markers, many of which are weakly evidence-based. Furthermore, categorizing the data as average, below or above average may lead to an inaccurate interpretation of the data. Lastly, the accuracy of the data is unclear. Finally, lack of data on length of stay and some major morbidities is a major weakness. We as physicians need to scrutinize these measurement systems and insist on greater methodological rigor and more relevant criteria to choose. Until these shortcomings are overcome, we cannot recommend the use of hospital rankings by patients or providers.

References

  1. http://www.medicare.gov/hospitalcompare/ (accessed 6/12/13).
  2. Fenton JJ, Jerant AF, Bertakis KD, Franks P. The cost of satisfaction: a national study of patient satisfaction, health care utilization, expenditures, and mortality. Arch Intern Med. 2012;172(5):405-11. [CrossRef] [PubMed]
  3. http://www.jointcommission.org/annualreport.aspx (accessed 6/12/13).
  4. http://www.hospitalsafetyscore.org (accessed 6/12/13).
  5. http://health.usnews.com/best-hospitals (accessed 6/12/13).
  6. Padrnos L, Bui T, Pattee JJ, Whitmore EJ, Iqbal M, Lee S, Singarajah CU, Robbins RA. Analysis of overall level of evidence behind the Institute of Healthcare Improvement ventilator-associated pneumonia guidelines. Southwest J Pulm Crit Care. 2011;3:40-8.
  7. Hurley J, Garciaorr R, Luedy H, Jivcu C, Wissa E, Jewell J, Whiting T, Gerkin R, Singarajah CU, Robbins RA. Correlation of compliance with central line associated blood stream infection guidelines and outcomes: a review of the evidence. Southwest J Pulm Crit Care. 2012;4:163-73.
  8. NICE-SUGAR Study Investigators. Intensive versus conventional insulin therapy in critically ill patients. N Engl J Med. 2009;360:1283-97. [CrossRef] [Pubmed]
  9. Robbins RA. The emperor has no clothes: the accuracy of hospital performance data. Southwest J Pulm Crit Care. 2012;5:203-5.
  10. Meddings JA, Reichert H, Rogers MA, Saint S, Stephansky J, McMahon LF. Effect of nonpayment for hospital-acquired, catheter-associated urinary tract infection: a statewide analysis. Ann Intern Med. 2012;157:305-12. [CrossRef] [PubMed]

Reference as: Robbins RA, Gerkin RD. A comparison between hospital rankings and outcomes data. Southwest J Pulm Crit Care. 2013;7(3):196-203. doi: http://dx.doi.org/10.13175/swjpcc076-13 PDF

Thursday
Jun132013

Comparisons between Medicare Mortality, Readmission and Complications

Richard A. Robbins, MD*

Richard D. Gerkin, MD  


*Phoenix Pulmonary and Critical Care Research and Education Foundation, Gilbert, AZ

Banner Good Samaritan Medical Center, Phoenix, AZ


Abstract

The Center for Medicare and Medicaid Services (CMS) has been a leading advocate of evidence-based medicine. Recently, CMS has begun adjusting payments to hospitals based on hospital readmission rates and “value-based performance” (VBP). Examination of the association of Medicare bonuses and penalties with mortality rates revealed that the hospitals with better mortality rates for heart attacks, heart failure and pneumonia had significantly greater penalties for readmission rates (p<0.0001, all comparisons). A number of specific complications listed in the CMS database were also examined for their correlations with mortality, readmission rates and Medicare bonuses and penalties. These results were inconsistent and suggest that CMS continues to rely on surrogate markers that have little or no correlation with patient-centered outcomes.

Introduction

Implementation of the Affordable Care Act (ACA) emphasized the use of evidence-based measures of care (1). However, the scientific basis for many of these performance measures and their correlation with patient-centered outcomes such as mortality, morbidity, length of stay and readmission rates have been questioned (2-6). Recently, CMS has begun adjusting payments based on readmission rates and “value-based performance” (VBP) (7). Readmission rates and complications are based on claims submitted by hospitals to Medicare (8).

We sought to examine the correlations between mortality, hospital readmission rates, complications and adjustments in Medicare reimbursement. If the system of determining Medicare reimbursements is based on achievement of better patient outcomes, then one hypothesis is that lower readmission rates would be associated with lower mortality.  An additional hypothesis is that complications would be inversely associated with both mortality and readmission rates. 

Methods

Hospital Compare

Data was obtained from the CMS Hospital Compare website from December 2012-January 2013 (8). The data reflects composite data of all hospitals that have submitted claims to CMS. Although a number of measures are listed, we recorded only readmissions, complications and deaths since many of the process of care measures have not been shown to correlate with improved outcomes. Patient satisfaction was not examined since higher patient satisfaction has been shown to correlate with higher admission rates to the hospital, higher overall health care expenditures, and increased mortality (9). In some instances data are presented in Hospital Compare as higher, lower or no different from the National average. In this case, scoring was done 2, 0 and 1 respectively with 0=higher, 2=lower and 1=no different.

Mortality

Mortality was obtained from Hospital Compare and is the 30-day estimates of deaths from any cause within 30 days of a hospital admission for patients hospitalized for heart attack, heart failure, or pneumonia regardless of whether the patient died while still in the hospital or after discharge. The mortality and rates are adjusted for patient characteristics including the patient’s age, gender, past medical history, and other diseases or conditions (comorbidities) the patient had at hospital arrival that are known to increase the patient’s risk of dying.

Readmission Rates

Similarly, the readmission rates are 30-day estimates of readmission for any cause to any acute care hospital within 30 days of discharge. These measures include patients who were initially hospitalized for heart attack, heart failure, and pneumonia. Similar to mortality, the readmission measures rates are adjusted for patient characteristics including the patient’s age, gender, past medical history, and other diseases or conditions (comorbidities) the patient had at hospital arrival that are known to increase the patient’s risk for readmission.

Complications

CMS calculates the rate for each complication by dividing the actual number of self-reported outcomes at each hospital by the number of eligible discharges for that measure at each hospital, multiplied by 1,000. The composite value reported on Hospital Compare is the weighted averages of the component indicators.  The measures of serious complications reported are risk adjusted to account for differences in hospital patients’ characteristics. In addition, the rates reported on Hospital Compare are “smoothed” to reflect the fact that measures for small hospitals are measured less accurately (i.e., are less reliable) than for larger hospitals.

CMS calculates the hospital acquired infection data from the claims hospitals submit to Medicare. The rate for each hospital acquired infection measure is calculated by dividing the number of infections that occur within any given eligible hospital by the number of eligible Medicare discharges, multiplied by 1,000. The hospital acquired infection rates were not risk adjusted by CMS.

In addition to the composite data, individual complications listed in the CMS database were examined (Table 1).

Table 1. Complications examined that are listed in CMS data base.

Objects Accidentally Left in the Body After Surgery

Air Bubble in the Bloodstream

Mismatched Blood Types

Severe Pressure Sores (Bed Sores)

Falls and Injuries

Blood Infection from a Catheter in a Large Vein

Infection from a Urinary Catheter

Signs of Uncontrolled Blood Sugar


Medicare Bonuses and Penalties

The CMS data was obtained from Kaiser Health News which had compiled the data into an Excel database (10).


Statistical Analysis

Data was reported as mean + standard error of mean (SEM). Outcomes between hospitals rated as better were compared to those of hospitals rated as average or worse using Student’s t-test. The relationship between continuous variables was obtained using the Pearson correlation coefficient. Significance was defined as p<0.05. All p values reported are nominal, with no correction for multiple comparisons.

Results

A large database was compiled for the CMS outcomes and each of the hospital ratings (Appendix 1). There were over 2500 hospitals listed in the database.

Mortality and Readmission Rates

A positive correlation for heart attack, heart failure and pneumonia was found between hospitals with better mortality rates (p<0.001 all comparisons). In other words, hospitals with better mortality rates for heart attack tended to be better mortality performers for heart failure and pneumonia, etc.  Surprisingly, the hospitals with better mortality rates for heart attack, heart failure and pneumonia had higher readmission rates for these diseases (p<0.001, all comparisons).

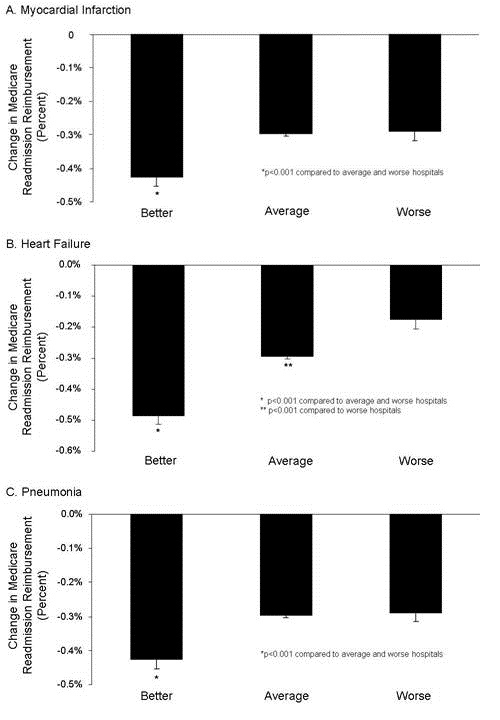
Examination of the association of Medicare bonuses and penalties with mortality rates revealed that the hospitals with better mortality rates for heart attacks, heart failure and pneumonia received the same compensation for value-based performance as hospitals with average or worse mortality rates (Appendix 2, p>0.05, all comparisons). However, these better hospitals had significantly larger penalties for readmission rates (Figure 1, p<0.0001, all comparisons). 


Figure 1.  Medicare bonuses and penalties for readmission rates of hospitals with better, average or worse mortality for myocardial infarction (heart attack, Panel A), heart failure (Panel B), and pneumonia (Panel C).

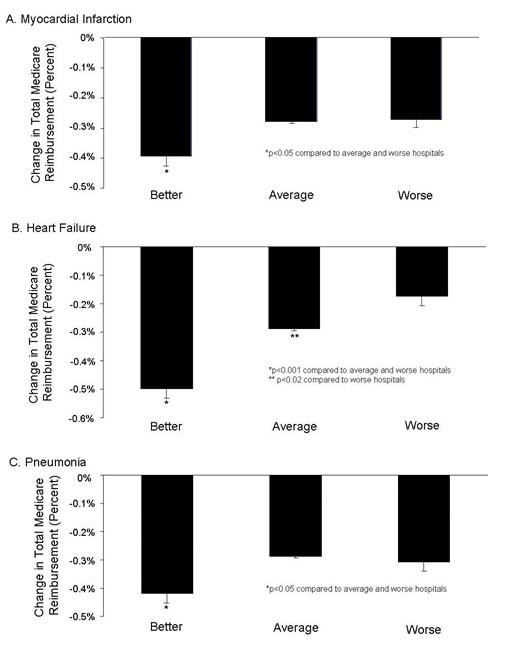
Because total Medicare penalties are the average of the adjustment for VBP and readmission rates, the reduction in reimbursement was reflected with higher total penalty rates for hospitals with better mortality rates for heart attacks, heart failure and pneumonia (Figure 2 , p<0.001, all comparisons).

Figure 2.  Total Medicare bonuses and penalties for readmission rates of hospitals with better, average or worse mortality for myocardial infarction (heart attack, Panel A), heart failure (Panel B), and pneumonia (Panel C).

Mortality Rates and Complications

The rates of a number of complications are also listed in the CMS database (Table 1). A correlation was performed for each complication compared to the hospitals with better, average or worse death and readmission rates for heart attacks, heart failure and pneumonia (Appendix 3). A positive correlation of hospitals with better mortality rates was only observed for falls and injuries in the hospitals with better death rates from heart failure (p<0.02). However, severe pressure sores also differed in the hospitals with better mortality rates for heart attack and heart failure, but this was a negative correlation (p<0.05 both comparisons). In other words, hospitals that performed better in mortality performed worse in severe pressure sores. Similarly, hospitals with better mortality rates for heart failure had higher rates of blood infection from a catheter in a large vein compared to hospitals with an average mortality rate (p<0.001). None of the remaining complications differed.

Readmission Rates and Complications

A correlation was also performed between complications and hospitals with better, average and worse readmission rates for myocardial infarction, heart failure, and pneumonia (Appendix 4). Infections from a urinary catheter and falls and injuries were more frequent in hospitals with better readmission rates for myocardial infarction, heart failure, and pneumonia compared to hospitals with the worse readmission rates (p<0.02, all comparisons). Hospitals with better readmission rates for heart failure also had higher infections from a urinary catheter compared to hospitals with average readmission rates for heart failure (p<0.001). None of the remaining complications significantly differed 

Discussion

The use of “value-based performance” (VBP) has been touted as having the potential for improving care, reducing complications and saving money. However, we identified a negative correlation between deaths and readmissions, i.e., those hospitals with the better mortality rates were receiving larger financial penalties for readmissions and total compensation. Furthermore, correlations of hospitals with better mortality and readmission rates with complications were inconsistent.

Our data compliments and extends the observations of Krumholz et al. (11). These investigators examined the CMS database from 2005-8 for the correlation between mortality and readmissions. They identified an inverse correlation between mortality and readmission rates with heart failure but not heart attacks or pneumonia. However, with the financial penalties now in place for readmissions, it now seems likely hospital practices may have changed.

CMS compensating hospitals for lower readmission rates is disturbing since higher readmission rates correlated with better mortality. This equates to rewarding hospitals for practices leading to lower readmission rates but increase mortality. The lack of correlation for the other half of the payment adjustment, so called “value-based purchasing” is equally disturbing since if apparently has little correlation with patient outcomes.

Although there is an inverse correlation between mortality and readmissions, this does not prove cause and effect. The causes of the inverse association between readmissions and mortality rates are unclear, but the most obvious would be that readmissions may benefit patient survival. The reason for the lack of correlation between mortality and readmission rates with most complication rates is also unclear. VBP appears to rely heavily on complications that are generally infrequent and in some cases may be inconsequential. Furthermore, many of the complications are for all intents and purposes self-reported by the hospitals to CMS since they are based on claims data. However, the accuracy of these data has been called into question (12,13). Meddings et al. (13) studied urinary tract infections. According to Meddings, the data were “inaccurate” and not were “not valid data sets for comparing hospital acquired catheter-associated urinary tract infection rates for the purpose of public reporting or imposing financial incentives or penalties”. The authors proposed that the nonpayment by Medicare for “reasonably preventable” hospital-acquired complications resulted in this discrepancy. Inaccurate data may lead to the lack of correlation a complication and outcomes on the CMS database.

According to the CMS website the complications were chosen by “wide agreement from CMS, the hospital industry and public sector stakeholders such as The Joint Commission (TJC) , the National Quality Forum (NQF), and the Agency for Healthcare Research and Quality (AHRQ) , and hospital industry leaders” (7). However, some complications such as air bubble in the bloodstream or mismatched blood types are quite rare. Others such as signs of uncontrolled blood sugar are not evidence-based (14). Other complications actually correlated with improved mortality or readmission rates. It seems likely that some of the complications might represent more aggressive treatment or could reflect increased clinical care staffing which has previously been associated with better survival (14,15). 

There are several limitations to our data. First and foremost, the data are derived from CMS Hospital Compare where the data has been self-reported by hospitals. The validity and accuracy of the data has been called into question (12,13). Second, data are missing in multiple instances. For example, data from Maryland were not present. There were multiple instances when the data were “unavailable” or the “number of cases are too small”. Third, in some instances CMS did not report actual data but only higher, lower or no different from the National average. Fourth, much of the data are from surrogate markers, a fact which is puzzling when patient-centered outcomes are available. In addition, some of these surrogate markers have not been shown to correlate with outcomes.

It is unclear if CMS Hospital Compare should be used by patients or healthcare providers when choosing a hospital. At present it would appear that the dizzying array of data reported overrelies on surrogate markers which are possibly inaccurate. Lack of adequate outcomes data and even obfuscating the data by reporting the data as average, below or above average does little to help shareholders interpret the data. The failure to apparently incorporate mortality rates as a component of VBP is another major limitation. The accuracy of the data is also unclear. Until these shortcomings can be improved, we cannot recommend the use of Hospital Compare by patients or providers.

References

  1. Obama B. Securing the future of American health care. N Engl J Med. 2012; 367:1377-81.
  2. Showalter JW, Rafferty CM, Swallow NA, Dasilva KO, Chuang CH. Effect of standardized electronic discharge instructions on post-discharge hospital utilization. J Gen Intern Med. 2011;26(7):718-23.
  3. Heidenreich PA, Hernandez AF, Yancy CW, Liang L, Peterson ED, Fonarow GC. Get With The Guidelines program participation, process of care, and outcome for Medicare patients hospitalized with heart failure. Circ Cardiovasc Qual Outcomes. 2012 ;5(1):37-43.
  4. Hurley J, Garciaorr R, Luedy H, Jivcu C, Wissa E, Jewell J, Whiting T, Gerkin R, Singarajah CU, Robbins RA. Correlation of compliance with central line associated blood stream infection guidelines and outcomes: a review of the evidence. Southwest J Pulm Crit Care. 2012;4:163-73.
  5. Robbins RA, Gerkin R, Singarajah CU. Relationship between the Veterans Healthcare Administration Hospital Performance Measures and Outcomes. Southwest J Pulm Crit Care 2011;3:92-133.
  6. Padrnos L, Bui T, Pattee JJ, Whitmore EJ, Iqbal M, Lee S, Singarajah CU, Robbins RA. Analysis of overall level of evidence behind the Institute of Healthcare Improvement ventilator-associated pneumonia guidelines. Southwest J Pulm Crit Care. 2011;3:40-8.
  7. http://www.medicare.gov/HospitalCompare/Data/linking-quality-to-payment.aspx (accessed 4/8/13).
  8. http://www.medicare.gov/hospitalcompare/ (accessed 4/8/13).
  9. Fenton JJ, Jerant AF, Bertakis KD, Franks P. The cost of satisfaction: a national study of patient satisfaction, health care utilization, expenditures, and mortality. Arch Intern Med. 2012;172:405-11.
  10. http://capsules.kaiserhealthnews.org/wp-content/uploads/2012/12/Value-Based-Purchasing-And-Readmissions-KHN.csv (accessed 4/8/13).
  11. Krumholz HM, Lin Z, Keenan PS, Chen J, Ross JS, Drye EE, Bernheim SM, Wang Y, Bradley EH, Han LF, Normand SL. Relationship between hospital readmission and mortality rates for patients hospitalized with acute myocardial infarction, heart failure, or pneumonia. JAMA. 2013;309(6):587-93. doi: 10.1001/jama.2013.333.
  12. Robbins RA. The emperor has no clothes: the accuracy of hospital performance data. Southwest J Pulm Crit Care. 2012;5:203-5.
  13. Meddings JA, Reichert H, Rogers MA, Saint S, Stephansky J, McMahon LF. Effect of nonpayment for hospital-acquired, catheter-associated urinary tract infection: a statewide analysis. Ann Intern Med. 2012;157:305-12.
  14. NICE-SUGAR Study Investigators. Intensive versus conventional insulin therapy in critically ill patients. N Engl J Med. 2009;360:1283-97.
  15. Robbins RA, Gerkin R, Singarajah CU. Correlation between patient outcomes and clinical costs in the va healthcare system. Southwest J Pulm Crit Care. 2012;4:94-100.

Reference as: Robbins RA, Gerkin RD. Comparisons between Medicare mortality, morbidity, readmission and complications. Southwest J Pulm Crit Care. 2013;6(6):278-86. PDF