Search Journal-type in search term and press enter
Southwest Pulmonary and Critical Care Fellowships

General Medicine

(Most recent listed first. Click on title to be directed to the manuscript.)

Infectious Diseases Telemedicine to the Arizona Department of Corrections
   During SARS-CoV-2 Pandemic. A Short Report.
The Potential Dangers of Quality Assurance, Physician Credentialing and
   Solutions for Their Improvement (Review)
Results of the SWJPCC Healthcare Survey
Who Are the Medically Poor and Who Will Care for Them?
Tacrolimus-Associated Diabetic Ketoacidosis: A Case Report and Literature 
   Review
Nursing Magnet Hospitals Have Better CMS Hospital Compare Ratings
Publish or Perish: Tools for Survival
Is Quality of Healthcare Improving in the US?
Survey Shows Support for the Hospital Executive Compensation Act
The Disruptive Administrator: Tread with Care
A Qualitative Systematic Review of the Professionalization of the 
   Vice Chair for Education
Nurse Practitioners' Substitution for Physicians
National Health Expenditures: The Past, Present, Future and Solutions
Credibility and (Dis)Use of Feedback to Inform Teaching : A Qualitative
Case Study of Physician-Faculty Perspectives
Special Article: Physician Burnout-The Experience of Three Physicians
Brief Review: Dangers of the Electronic Medical Record
Finding a Mentor: The Complete Examination of an Online Academic 
   Matchmaking Tool for Physician-Faculty
Make Your Own Mistakes
Professionalism: Capacity, Empathy, Humility and Overall Attitude
Professionalism: Secondary Goals 
Professionalism: Definition and Qualities
Professionalism: Introduction
The Unfulfilled Promise of the Quality Movement
A Comparison Between Hospital Rankings and Outcomes Data
Profiles in Medical Courage: John Snow and the Courage of
   Conviction
Comparisons between Medicare Mortality, Readmission and
   Complications
In Vitro Versus In Vivo Culture Sensitivities:
   An Unchecked Assumption?
Profiles in Medical Courage: Thomas Kummet and the Courage to
   Fight Bureaucracy
Profiles in Medical Courage: The Courage to Serve
and Jamie Garcia
Profiles in Medical Courage: Women’s Rights and Sima Samar
Profiles in Medical Courage: Causation and Austin Bradford Hill
Profiles in Medical Courage: Evidence-Based 
Medicine and Archie Cochrane
Profiles of Medical Courage: The Courage to Experiment and 
   Barry Marshall
Profiles in Medical Courage: Joseph Goldberger,
   the Sharecropper’s Plague, Science and Prejudice
Profiles in Medical Courage: Peter Wilmshurst,
   the Physician Fugitive
Correlation between Patient Outcomes and Clinical Costs
   in the VA Healthcare System
Profiles in Medical Courage: Of Mice, Maggots 
   and Steve Klotz
Profiles in Medical Courage: Michael Wilkins
   and the Willowbrook School
Relationship Between The Veterans Healthcare Administration
   Hospital Performance Measures And Outcomes 


Although the Southwest Journal of Pulmonary and Critical Care was started as a pulmonary/critical care/sleep journal, we have received and continue to receive submissions that are of general medical interest. For this reason, a new section entitled General Medicine was created on 3/14/12. Some articles were moved from pulmonary to this new section since it was felt they fit better into this category.

-------------------------------------------------------------------------------------

Entries in complication (2)

Tuesday
Feb272018

Tacrolimus-Associated Diabetic Ketoacidosis: A Case Report and Literature Review

Stella Pak, MD1

Megan Hirschbeck, BS2

Damian Valencia, MD1

Victor Valencia, BS3

Yusuf Askaroglu, BS2

Dexter Nye, BS2

Adam Fershko, MD2


1Departments of Medicine, Kettering Medical Center, Kettering, Ohio USA

2Department of Medicine, Boonshoft School of Medicine, Dayton, Ohio USA 

3Department of Medicine, Northwestern University Feinberg School of Medicine, Chicago, Illinois USA


Abstract

Post-transplant diabetes mellitus is a well-established adverse effect of calcineurin inhibitors, such as tacrolimus and cyclosporine. Failure to identify and manage this side effect in a timely manner could lead to life-threatening complications like diabetic ketoacidosis (DKA). To the best of our knowledge, this is the seventh published case of an uncommon but severe, and potentially fatal, adverse effect from tacrolimus after renal transplantation. The purpose of this case report is to add to the scant body of literature on tacrolimus-induced diabetes following renal transplantation.

Introduction

New-onset diabetes mellitus after transplantation (NODAT) is a well-established adverse effect of calcineurin inhibitors, such as tacrolimus and cyclosporine. NODAT has been reported to occur in 13.4% of patients after solid organ transplantation, with a higher incidence in patients receiving tacrolimus than cyclosporine, 16.6% and 9.8% respectively (1). Failure to identify and manage this side effect in a timely manner could lead to life-threatening complications like diabetic ketoacidosis (DKA). Currently, only seven reported cases, including this report, of NODAT with DKA exist in the English literature. This case report describes a patient who developed tacrolimus-induced diabetic ketoacidosis three months after receiving renal transplantation.

Case Description

The patient is a 44-year-old Caucasian male with no past medical history of diabetes mellitus who presented with diabetic ketoacidosis three months after receiving a deceased-donor kidney transplant for end stage renal disease secondary to autosomal dominant polycystic kidney disease. The patient’s immunosuppressive regimen included tacrolimus, mycophenolate and low dose prednisone (5 mg daily). The patient initially presented with complaints of nausea and polyuria. He did not have a family history of diabetes mellitus. Physical examination was unremarkable except for a body mass index (BMI) of 27 kg/m2. Laboratory work-up revealed hyperglycemia with a glucose of 493; an anion gap metabolic acidosis with pH at 7.32 and bicarbonate at 19; significant ketosis; and ketonuria. Glycated hemoglobin (hemoglobin A1c) was 9.8 % compared to 4.8% thirty days post-transplant. Tacrolimus trough level was in the therapeutic range. Glutamic acid decarboxylase (GAD-65) autoantibodies were negative. The patient received intravenous fluids, a bolus of intravenous insulin followed by a continuous insulin infusion which was soon switched to subcutaneous insulin. Upon resolution of the patients DKA, the total daily maintenance insulin requirements were approximately 40 units. The patient received diabetic education and was discharged home.

Discussion

At the time of writing this report, there were only six reported cases of NODAT following the use of cyclosporine inhibitors such as tacrolimus which are summarized in table 1 (2-7).

Table 1. Summary of the seven reported cases focused on clinical presentation and management.

BMI: body-mass-index; M: male; F: female; BM: bone marrow; TAC: tacrolimus; MPL: methylprednisolone; PDL: prednisolone; PDN: prednisone; MPS: mycophenolate sodium; MMF: mycophenolate mofetil; AZT: azathioprine; CYC: cyclosporine; RG: random glucose; FG: fasting glucose; Yr: year; Mo: month; Wk: week; NA: not available; DM: diabetes mellitus; Tx: therapy

Five of the now seven reported cases detail the development of diabetic ketoacidosis at least six months after renal transplantation (2-5, 7). In contrast, our case and the case detailed by Dr. Tuğcu and his colleagues describe the presentation of DKA and new onset diabetes within three months of transplantation (6).

Maintenance immunosuppressive therapy is essential to prevent organ rejection in renal transplant recipients. Calcineurin inhibitors play an integral role in most immunosuppressive regimens, with tacrolimus being the preferred agent over cyclosporine, as several studies show lower incidence of acute rejection with its use (1). Both calcineurin inhibitors are known to cause toxicity to pancreatic islet beta cells and may also directly affect transcriptional regulation of insulin expression (5). Evidence suggests that tacrolimus causes greater incidence of severe swelling-vacuolization, endoplasmic reticulum stress and apoptosis of pancreatic islet beta cells when compared to cyclosporine (8). Tacrolimus associated diabetogenic effects threaten the health and longevity of the allograft by predisposing the recipients to microvascular and macrovascular diabetic complications which subsequently reduce allograft survival.

The development of diabetes mellitus Type 1 with ketoacidosis in patients on therapeutic tacrolimus with no risk factors for diabetes highlights the need for alternative immunosuppressive agents which won’t compromise long-term survival of the patients’ allograft. This case report highlights the importance of regular fasting blood glucose monitoring in patients on a tacrolimus-regimen for immunosuppression in order to prevent the life-threatening complication of diabetic ketoacidosis and subsequent allograft rejection in the setting of uncontrolled diabetes mellitus.

Post-transplant diabetes mellitus is associated with increased mortality, by approximately 10 %, among renal transplant patients. The reduction in survival rate due to post-transplant diabetes mellitus is largely due to cardiovascular disease, such as coronary artery disease and congestive heart failure (9). Given the negative impact of NODAT in the survival of renal transplant patients, preventive efforts should be made to minimize risk factors. Known risk factors for NODAT include obesity, hepatitis C, African American race, Hispanic ethnicity, family history of diabetes mellitus, use of calcineurin inhibitor and/or corticosteroid. Early identification of patients at high risk for NODAT would help tailor immunotherapeutic suppressant regimen and to aggressively manage modifiable risk factors for NODAT (10, 11). The International Diabetes Federation (IDF) recommends proactive prescreening of all post-transplant patients for NODAT, with measurement of fast plasma glucose at least once per week for first 4 weeks post-transplant. Afterwards, post-transplant patients should have fasting plasma glucose test at 3, 6, 12 months, at 1-year intervals thereafter. Glycated hemoglobin (Hemoglobin A1C) is recommended to be check at 3 months following the transplant procedure (12).

Calcineurin inhibitors, including tacrolimus and cyclosporine, inhibit calcineurin in β-cells of the pancreas. Inhibition of calcineurin indirectly suppresses expression of genes involved in insulin production. In particular, adverse glycemic effect occurs with a greater incidence with tacrolimus than cyclosporine. This is thought to be mostly due to tacrolimus-induced changes in the level of β-cell enriched transcription factors, forkhead box protein O1 (FoxO1) and v-maf musculoaponeurotic fibrosarcoma oncogene homolog A (MafA). Tacrolimus selectively promotes nuclear translocation of FoxO1 and cytoplasmic location of MafA. These modulations of transcript factors then cause β-cell dysfunction, attributing to the development of NODAT (13).

Conclusion

Considering the potentially devastating complication of allograft compromise due to undiagnosed NODAT, it is imperative that clinicians monitor patients for signs of impaired glucose metabolism, specifically those who are treated with tacrolimus.

References

  1. Heisel O, Heisel R, Balshaw R, Keown P. New onset diabetes mellitus in patients receiving calcineurin inhibitors: a systematic review and meta-analysis. Am J Transplant. 2004;4:583-95. [CrossRef] [PubMed]
  2. Cho YM, Park KS, Jung HS, Kim YS, Kim SY, Lee HK. A case showing complete insulin independence after severe diabetic ketoacidosis associated with tacrolimus treatment. Diabetes Care. 2002;25:1664. [CrossRef] [PubMed]
  3. Ersoy A, Ersoy C, Tekce H, Yavascaoglu I, Dilek K. Diabetic ketoacidosis following development of de novo diabetes in renal transplant recipient associated with tacrolimus. Transplant Proc. 2004;36:1407-10. [CrossRef] [PubMed]
  4. Masood MQ, Rabbani M, Jafri W, Habib M, Saleem T. Diabetic ketoacidosis associated with tacrolimus in solid organ transplant recipients. J Pak Med Assoc. 2011;61:288-90. [PubMed]
  5. Toyonaga T, Kondo T, Miyamura N, et al. Sudden onset of diabetes with ketoacidosis in a patient treated with FK506/tacrolimus. Diabetes Res Clin Pract. 2002;56:13-8. [CrossRef] [PubMed
  6. Tuğcu M, Kasapoglu U, Boynuegri B, et al. Tacrolimus-Induced Diabetic Ketoacidosis and Effect of Switching to Everolimus: A Case Report. Transplant Proc. 2015;47:1528-30. [CrossRef] [PubMed]
  7. Yoshida EM, Buczkowski AK, Sirrs SM, et al. Post-transplant diabetic ketoacidosis--a possible consequence of immunosuppression with calcineurin inhibiting agents: a case series. Transpl Int. 2000;13:69-72. [CrossRef] [PubMed]
  8. Rangel EB. Tacrolimus in pancreas transplant: a focus on toxicity, diabetogenic effect and drug-drug interactions. Expert Opin Drug Metab Toxicol. 2014;10: 1585-605. [CrossRef] [PubMed]
  9. Shivaswamy V, Boerner B, Larsen J. Post-transplant diabetes mellitus: causes, treatment, and impact on outcomes. Endocr Rev. 2016;37(1):37-61. [CrossRef] [PubMed]
  10. Kasiske BL, Snyder JJ, Gilbertson D, Matus AJ. Diabetes mellitus after kidney transplantation in the United States. Am J Transplant. 2003;3:178-85. [CrossRef] [PubMed]
  11. Karavelioglu D, Baysal C, Ozdemir N et al. Impact of HCV infection on the development of post transplantation diabetes mellitus in renal allograft recipients. Transplantation Proc. 2000;32;(3):561-2. [CrossRef] [PubMed]
  12. Wilkinson A, Davidson J, Dotta F et al. Guidelines for the treatment and management of new onset of diabetes after transplantation. Clin Transplant. 2005;19:291-8. [CrossRef] [PubMed]
  13. Trianes J, Rodriguez-Rodriguez AE, Brito-Cassilas Y, et al. Deciphering tacrolimus-induced toxicity in pancreatic β cells. Am J Transplant. 2017;17: 2829-40. [CrossRef] [PubMed] 

Cite as: Pak S, Hirschbeck M, Valencia D, Valencia V, Askaroglu Y, Nye D, Fershko A. Tacrolimus-associated diabetic ketoacidosis: a case report and literature review. Southwest J Pulm Crit Care. 2018;16(2):103-7. doi: https://doi.org/10.13175/swjpcc015-18 PDF 

Thursday
Jun132013

Comparisons between Medicare Mortality, Readmission and Complications

Richard A. Robbins, MD*

Richard D. Gerkin, MD  


*Phoenix Pulmonary and Critical Care Research and Education Foundation, Gilbert, AZ

Banner Good Samaritan Medical Center, Phoenix, AZ


Abstract

The Center for Medicare and Medicaid Services (CMS) has been a leading advocate of evidence-based medicine. Recently, CMS has begun adjusting payments to hospitals based on hospital readmission rates and “value-based performance” (VBP). Examination of the association of Medicare bonuses and penalties with mortality rates revealed that the hospitals with better mortality rates for heart attacks, heart failure and pneumonia had significantly greater penalties for readmission rates (p<0.0001, all comparisons). A number of specific complications listed in the CMS database were also examined for their correlations with mortality, readmission rates and Medicare bonuses and penalties. These results were inconsistent and suggest that CMS continues to rely on surrogate markers that have little or no correlation with patient-centered outcomes.

Introduction

Implementation of the Affordable Care Act (ACA) emphasized the use of evidence-based measures of care (1). However, the scientific basis for many of these performance measures and their correlation with patient-centered outcomes such as mortality, morbidity, length of stay and readmission rates have been questioned (2-6). Recently, CMS has begun adjusting payments based on readmission rates and “value-based performance” (VBP) (7). Readmission rates and complications are based on claims submitted by hospitals to Medicare (8).

We sought to examine the correlations between mortality, hospital readmission rates, complications and adjustments in Medicare reimbursement. If the system of determining Medicare reimbursements is based on achievement of better patient outcomes, then one hypothesis is that lower readmission rates would be associated with lower mortality.  An additional hypothesis is that complications would be inversely associated with both mortality and readmission rates. 

Methods

Hospital Compare

Data was obtained from the CMS Hospital Compare website from December 2012-January 2013 (8). The data reflects composite data of all hospitals that have submitted claims to CMS. Although a number of measures are listed, we recorded only readmissions, complications and deaths since many of the process of care measures have not been shown to correlate with improved outcomes. Patient satisfaction was not examined since higher patient satisfaction has been shown to correlate with higher admission rates to the hospital, higher overall health care expenditures, and increased mortality (9). In some instances data are presented in Hospital Compare as higher, lower or no different from the National average. In this case, scoring was done 2, 0 and 1 respectively with 0=higher, 2=lower and 1=no different.

Mortality

Mortality was obtained from Hospital Compare and is the 30-day estimates of deaths from any cause within 30 days of a hospital admission for patients hospitalized for heart attack, heart failure, or pneumonia regardless of whether the patient died while still in the hospital or after discharge. The mortality and rates are adjusted for patient characteristics including the patient’s age, gender, past medical history, and other diseases or conditions (comorbidities) the patient had at hospital arrival that are known to increase the patient’s risk of dying.

Readmission Rates

Similarly, the readmission rates are 30-day estimates of readmission for any cause to any acute care hospital within 30 days of discharge. These measures include patients who were initially hospitalized for heart attack, heart failure, and pneumonia. Similar to mortality, the readmission measures rates are adjusted for patient characteristics including the patient’s age, gender, past medical history, and other diseases or conditions (comorbidities) the patient had at hospital arrival that are known to increase the patient’s risk for readmission.

Complications

CMS calculates the rate for each complication by dividing the actual number of self-reported outcomes at each hospital by the number of eligible discharges for that measure at each hospital, multiplied by 1,000. The composite value reported on Hospital Compare is the weighted averages of the component indicators.  The measures of serious complications reported are risk adjusted to account for differences in hospital patients’ characteristics. In addition, the rates reported on Hospital Compare are “smoothed” to reflect the fact that measures for small hospitals are measured less accurately (i.e., are less reliable) than for larger hospitals.

CMS calculates the hospital acquired infection data from the claims hospitals submit to Medicare. The rate for each hospital acquired infection measure is calculated by dividing the number of infections that occur within any given eligible hospital by the number of eligible Medicare discharges, multiplied by 1,000. The hospital acquired infection rates were not risk adjusted by CMS.

In addition to the composite data, individual complications listed in the CMS database were examined (Table 1).

Table 1. Complications examined that are listed in CMS data base.

Objects Accidentally Left in the Body After Surgery

Air Bubble in the Bloodstream

Mismatched Blood Types

Severe Pressure Sores (Bed Sores)

Falls and Injuries

Blood Infection from a Catheter in a Large Vein

Infection from a Urinary Catheter

Signs of Uncontrolled Blood Sugar


Medicare Bonuses and Penalties

The CMS data was obtained from Kaiser Health News which had compiled the data into an Excel database (10).


Statistical Analysis

Data was reported as mean + standard error of mean (SEM). Outcomes between hospitals rated as better were compared to those of hospitals rated as average or worse using Student’s t-test. The relationship between continuous variables was obtained using the Pearson correlation coefficient. Significance was defined as p<0.05. All p values reported are nominal, with no correction for multiple comparisons.

Results

A large database was compiled for the CMS outcomes and each of the hospital ratings (Appendix 1). There were over 2500 hospitals listed in the database.

Mortality and Readmission Rates

A positive correlation for heart attack, heart failure and pneumonia was found between hospitals with better mortality rates (p<0.001 all comparisons). In other words, hospitals with better mortality rates for heart attack tended to be better mortality performers for heart failure and pneumonia, etc.  Surprisingly, the hospitals with better mortality rates for heart attack, heart failure and pneumonia had higher readmission rates for these diseases (p<0.001, all comparisons).

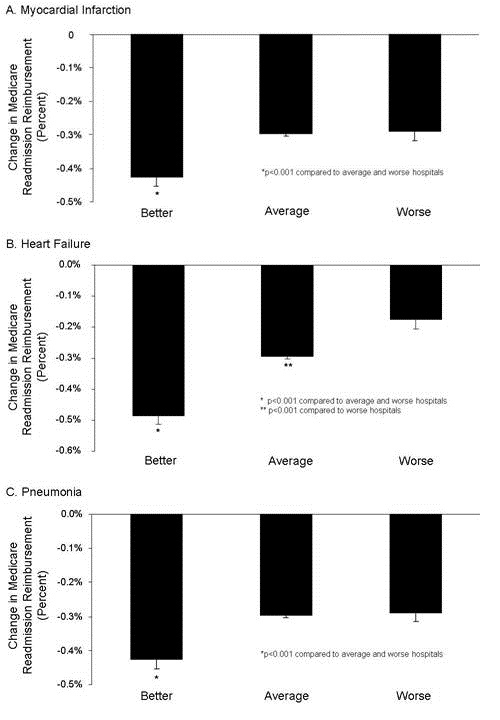
Examination of the association of Medicare bonuses and penalties with mortality rates revealed that the hospitals with better mortality rates for heart attacks, heart failure and pneumonia received the same compensation for value-based performance as hospitals with average or worse mortality rates (Appendix 2, p>0.05, all comparisons). However, these better hospitals had significantly larger penalties for readmission rates (Figure 1, p<0.0001, all comparisons). 


Figure 1.  Medicare bonuses and penalties for readmission rates of hospitals with better, average or worse mortality for myocardial infarction (heart attack, Panel A), heart failure (Panel B), and pneumonia (Panel C).

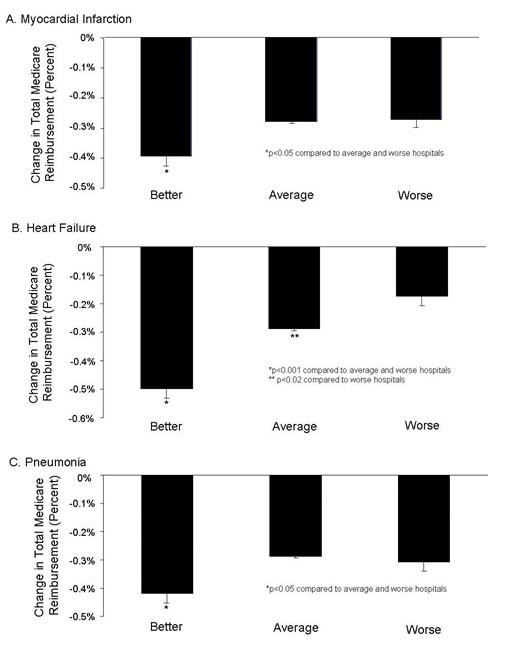
Because total Medicare penalties are the average of the adjustment for VBP and readmission rates, the reduction in reimbursement was reflected with higher total penalty rates for hospitals with better mortality rates for heart attacks, heart failure and pneumonia (Figure 2 , p<0.001, all comparisons).

Figure 2.  Total Medicare bonuses and penalties for readmission rates of hospitals with better, average or worse mortality for myocardial infarction (heart attack, Panel A), heart failure (Panel B), and pneumonia (Panel C).

Mortality Rates and Complications

The rates of a number of complications are also listed in the CMS database (Table 1). A correlation was performed for each complication compared to the hospitals with better, average or worse death and readmission rates for heart attacks, heart failure and pneumonia (Appendix 3). A positive correlation of hospitals with better mortality rates was only observed for falls and injuries in the hospitals with better death rates from heart failure (p<0.02). However, severe pressure sores also differed in the hospitals with better mortality rates for heart attack and heart failure, but this was a negative correlation (p<0.05 both comparisons). In other words, hospitals that performed better in mortality performed worse in severe pressure sores. Similarly, hospitals with better mortality rates for heart failure had higher rates of blood infection from a catheter in a large vein compared to hospitals with an average mortality rate (p<0.001). None of the remaining complications differed.

Readmission Rates and Complications

A correlation was also performed between complications and hospitals with better, average and worse readmission rates for myocardial infarction, heart failure, and pneumonia (Appendix 4). Infections from a urinary catheter and falls and injuries were more frequent in hospitals with better readmission rates for myocardial infarction, heart failure, and pneumonia compared to hospitals with the worse readmission rates (p<0.02, all comparisons). Hospitals with better readmission rates for heart failure also had higher infections from a urinary catheter compared to hospitals with average readmission rates for heart failure (p<0.001). None of the remaining complications significantly differed 

Discussion

The use of “value-based performance” (VBP) has been touted as having the potential for improving care, reducing complications and saving money. However, we identified a negative correlation between deaths and readmissions, i.e., those hospitals with the better mortality rates were receiving larger financial penalties for readmissions and total compensation. Furthermore, correlations of hospitals with better mortality and readmission rates with complications were inconsistent.

Our data compliments and extends the observations of Krumholz et al. (11). These investigators examined the CMS database from 2005-8 for the correlation between mortality and readmissions. They identified an inverse correlation between mortality and readmission rates with heart failure but not heart attacks or pneumonia. However, with the financial penalties now in place for readmissions, it now seems likely hospital practices may have changed.

CMS compensating hospitals for lower readmission rates is disturbing since higher readmission rates correlated with better mortality. This equates to rewarding hospitals for practices leading to lower readmission rates but increase mortality. The lack of correlation for the other half of the payment adjustment, so called “value-based purchasing” is equally disturbing since if apparently has little correlation with patient outcomes.

Although there is an inverse correlation between mortality and readmissions, this does not prove cause and effect. The causes of the inverse association between readmissions and mortality rates are unclear, but the most obvious would be that readmissions may benefit patient survival. The reason for the lack of correlation between mortality and readmission rates with most complication rates is also unclear. VBP appears to rely heavily on complications that are generally infrequent and in some cases may be inconsequential. Furthermore, many of the complications are for all intents and purposes self-reported by the hospitals to CMS since they are based on claims data. However, the accuracy of these data has been called into question (12,13). Meddings et al. (13) studied urinary tract infections. According to Meddings, the data were “inaccurate” and not were “not valid data sets for comparing hospital acquired catheter-associated urinary tract infection rates for the purpose of public reporting or imposing financial incentives or penalties”. The authors proposed that the nonpayment by Medicare for “reasonably preventable” hospital-acquired complications resulted in this discrepancy. Inaccurate data may lead to the lack of correlation a complication and outcomes on the CMS database.

According to the CMS website the complications were chosen by “wide agreement from CMS, the hospital industry and public sector stakeholders such as The Joint Commission (TJC) , the National Quality Forum (NQF), and the Agency for Healthcare Research and Quality (AHRQ) , and hospital industry leaders” (7). However, some complications such as air bubble in the bloodstream or mismatched blood types are quite rare. Others such as signs of uncontrolled blood sugar are not evidence-based (14). Other complications actually correlated with improved mortality or readmission rates. It seems likely that some of the complications might represent more aggressive treatment or could reflect increased clinical care staffing which has previously been associated with better survival (14,15). 

There are several limitations to our data. First and foremost, the data are derived from CMS Hospital Compare where the data has been self-reported by hospitals. The validity and accuracy of the data has been called into question (12,13). Second, data are missing in multiple instances. For example, data from Maryland were not present. There were multiple instances when the data were “unavailable” or the “number of cases are too small”. Third, in some instances CMS did not report actual data but only higher, lower or no different from the National average. Fourth, much of the data are from surrogate markers, a fact which is puzzling when patient-centered outcomes are available. In addition, some of these surrogate markers have not been shown to correlate with outcomes.

It is unclear if CMS Hospital Compare should be used by patients or healthcare providers when choosing a hospital. At present it would appear that the dizzying array of data reported overrelies on surrogate markers which are possibly inaccurate. Lack of adequate outcomes data and even obfuscating the data by reporting the data as average, below or above average does little to help shareholders interpret the data. The failure to apparently incorporate mortality rates as a component of VBP is another major limitation. The accuracy of the data is also unclear. Until these shortcomings can be improved, we cannot recommend the use of Hospital Compare by patients or providers.

References

  1. Obama B. Securing the future of American health care. N Engl J Med. 2012; 367:1377-81.
  2. Showalter JW, Rafferty CM, Swallow NA, Dasilva KO, Chuang CH. Effect of standardized electronic discharge instructions on post-discharge hospital utilization. J Gen Intern Med. 2011;26(7):718-23.
  3. Heidenreich PA, Hernandez AF, Yancy CW, Liang L, Peterson ED, Fonarow GC. Get With The Guidelines program participation, process of care, and outcome for Medicare patients hospitalized with heart failure. Circ Cardiovasc Qual Outcomes. 2012 ;5(1):37-43.
  4. Hurley J, Garciaorr R, Luedy H, Jivcu C, Wissa E, Jewell J, Whiting T, Gerkin R, Singarajah CU, Robbins RA. Correlation of compliance with central line associated blood stream infection guidelines and outcomes: a review of the evidence. Southwest J Pulm Crit Care. 2012;4:163-73.
  5. Robbins RA, Gerkin R, Singarajah CU. Relationship between the Veterans Healthcare Administration Hospital Performance Measures and Outcomes. Southwest J Pulm Crit Care 2011;3:92-133.
  6. Padrnos L, Bui T, Pattee JJ, Whitmore EJ, Iqbal M, Lee S, Singarajah CU, Robbins RA. Analysis of overall level of evidence behind the Institute of Healthcare Improvement ventilator-associated pneumonia guidelines. Southwest J Pulm Crit Care. 2011;3:40-8.
  7. http://www.medicare.gov/HospitalCompare/Data/linking-quality-to-payment.aspx (accessed 4/8/13).
  8. http://www.medicare.gov/hospitalcompare/ (accessed 4/8/13).
  9. Fenton JJ, Jerant AF, Bertakis KD, Franks P. The cost of satisfaction: a national study of patient satisfaction, health care utilization, expenditures, and mortality. Arch Intern Med. 2012;172:405-11.
  10. http://capsules.kaiserhealthnews.org/wp-content/uploads/2012/12/Value-Based-Purchasing-And-Readmissions-KHN.csv (accessed 4/8/13).
  11. Krumholz HM, Lin Z, Keenan PS, Chen J, Ross JS, Drye EE, Bernheim SM, Wang Y, Bradley EH, Han LF, Normand SL. Relationship between hospital readmission and mortality rates for patients hospitalized with acute myocardial infarction, heart failure, or pneumonia. JAMA. 2013;309(6):587-93. doi: 10.1001/jama.2013.333.
  12. Robbins RA. The emperor has no clothes: the accuracy of hospital performance data. Southwest J Pulm Crit Care. 2012;5:203-5.
  13. Meddings JA, Reichert H, Rogers MA, Saint S, Stephansky J, McMahon LF. Effect of nonpayment for hospital-acquired, catheter-associated urinary tract infection: a statewide analysis. Ann Intern Med. 2012;157:305-12.
  14. NICE-SUGAR Study Investigators. Intensive versus conventional insulin therapy in critically ill patients. N Engl J Med. 2009;360:1283-97.
  15. Robbins RA, Gerkin R, Singarajah CU. Correlation between patient outcomes and clinical costs in the va healthcare system. Southwest J Pulm Crit Care. 2012;4:94-100.

Reference as: Robbins RA, Gerkin RD. Comparisons between Medicare mortality, morbidity, readmission and complications. Southwest J Pulm Crit Care. 2013;6(6):278-86. PDF