Search Journal-type in search term and press enter
Southwest Pulmonary and Critical Care Fellowships
In Memoriam

General Medicine

(Click on title to be directed to posting, most recent listed first)

Infectious Diseases Telemedicine to the Arizona Department of Corrections
   During SARS-CoV-2 Pandemic. A Short Report.
The Potential Dangers of Quality Assurance, Physician Credentialing and
   Solutions for Their Improvement (Review)
Results of the SWJPCC Healthcare Survey
Who Are the Medically Poor and Who Will Care for Them?
Tacrolimus-Associated Diabetic Ketoacidosis: A Case Report and Literature 
   Review
Nursing Magnet Hospitals Have Better CMS Hospital Compare Ratings
Publish or Perish: Tools for Survival
Is Quality of Healthcare Improving in the US?
Survey Shows Support for the Hospital Executive Compensation Act
The Disruptive Administrator: Tread with Care
A Qualitative Systematic Review of the Professionalization of the 
   Vice Chair for Education
Nurse Practitioners' Substitution for Physicians
National Health Expenditures: The Past, Present, Future and Solutions
Credibility and (Dis)Use of Feedback to Inform Teaching : A Qualitative
Case Study of Physician-Faculty Perspectives
Special Article: Physician Burnout-The Experience of Three Physicians
Brief Review: Dangers of the Electronic Medical Record
Finding a Mentor: The Complete Examination of an Online Academic 
   Matchmaking Tool for Physician-Faculty
Make Your Own Mistakes
Professionalism: Capacity, Empathy, Humility and Overall Attitude
Professionalism: Secondary Goals 
Professionalism: Definition and Qualities
Professionalism: Introduction
The Unfulfilled Promise of the Quality Movement
A Comparison Between Hospital Rankings and Outcomes Data
Profiles in Medical Courage: John Snow and the Courage of
   Conviction
Comparisons between Medicare Mortality, Readmission and
   Complications
In Vitro Versus In Vivo Culture Sensitivities:
   An Unchecked Assumption?
Profiles in Medical Courage: Thomas Kummet and the Courage to
   Fight Bureaucracy
Profiles in Medical Courage: The Courage to Serve
and Jamie Garcia
Profiles in Medical Courage: Women’s Rights and Sima Samar
Profiles in Medical Courage: Causation and Austin Bradford Hill
Profiles in Medical Courage: Evidence-Based 
Medicine and Archie Cochrane
Profiles of Medical Courage: The Courage to Experiment and 
   Barry Marshall
Profiles in Medical Courage: Joseph Goldberger,
   the Sharecropper’s Plague, Science and Prejudice
Profiles in Medical Courage: Peter Wilmshurst,
   the Physician Fugitive
Correlation between Patient Outcomes and Clinical Costs
   in the VA Healthcare System
Profiles in Medical Courage: Of Mice, Maggots 
   and Steve Klotz
Profiles in Medical Courage: Michael Wilkins
   and the Willowbrook School
Relationship Between The Veterans Healthcare Administration
   Hospital Performance Measures And Outcomes 


Although the Southwest Journal of Pulmonary and Critical Care was started as a pulmonary/critical care/sleep journal, we have received and continue to receive submissions that are of general medical interest. For this reason, a new section entitled General Medicine was created on 3/14/12. Some articles were moved from pulmonary to this new section since it was felt they fit better into this category.

-------------------------------------------------------------------------------------

Entries in readmission (2)

Thursday
Jun132013

Comparisons between Medicare Mortality, Readmission and Complications

Richard A. Robbins, MD*

Richard D. Gerkin, MD  


*Phoenix Pulmonary and Critical Care Research and Education Foundation, Gilbert, AZ

Banner Good Samaritan Medical Center, Phoenix, AZ


Abstract

The Center for Medicare and Medicaid Services (CMS) has been a leading advocate of evidence-based medicine. Recently, CMS has begun adjusting payments to hospitals based on hospital readmission rates and “value-based performance” (VBP). Examination of the association of Medicare bonuses and penalties with mortality rates revealed that the hospitals with better mortality rates for heart attacks, heart failure and pneumonia had significantly greater penalties for readmission rates (p<0.0001, all comparisons). A number of specific complications listed in the CMS database were also examined for their correlations with mortality, readmission rates and Medicare bonuses and penalties. These results were inconsistent and suggest that CMS continues to rely on surrogate markers that have little or no correlation with patient-centered outcomes.

Introduction

Implementation of the Affordable Care Act (ACA) emphasized the use of evidence-based measures of care (1). However, the scientific basis for many of these performance measures and their correlation with patient-centered outcomes such as mortality, morbidity, length of stay and readmission rates have been questioned (2-6). Recently, CMS has begun adjusting payments based on readmission rates and “value-based performance” (VBP) (7). Readmission rates and complications are based on claims submitted by hospitals to Medicare (8).

We sought to examine the correlations between mortality, hospital readmission rates, complications and adjustments in Medicare reimbursement. If the system of determining Medicare reimbursements is based on achievement of better patient outcomes, then one hypothesis is that lower readmission rates would be associated with lower mortality.  An additional hypothesis is that complications would be inversely associated with both mortality and readmission rates. 

Methods

Hospital Compare

Data was obtained from the CMS Hospital Compare website from December 2012-January 2013 (8). The data reflects composite data of all hospitals that have submitted claims to CMS. Although a number of measures are listed, we recorded only readmissions, complications and deaths since many of the process of care measures have not been shown to correlate with improved outcomes. Patient satisfaction was not examined since higher patient satisfaction has been shown to correlate with higher admission rates to the hospital, higher overall health care expenditures, and increased mortality (9). In some instances data are presented in Hospital Compare as higher, lower or no different from the National average. In this case, scoring was done 2, 0 and 1 respectively with 0=higher, 2=lower and 1=no different.

Mortality

Mortality was obtained from Hospital Compare and is the 30-day estimates of deaths from any cause within 30 days of a hospital admission for patients hospitalized for heart attack, heart failure, or pneumonia regardless of whether the patient died while still in the hospital or after discharge. The mortality and rates are adjusted for patient characteristics including the patient’s age, gender, past medical history, and other diseases or conditions (comorbidities) the patient had at hospital arrival that are known to increase the patient’s risk of dying.

Readmission Rates

Similarly, the readmission rates are 30-day estimates of readmission for any cause to any acute care hospital within 30 days of discharge. These measures include patients who were initially hospitalized for heart attack, heart failure, and pneumonia. Similar to mortality, the readmission measures rates are adjusted for patient characteristics including the patient’s age, gender, past medical history, and other diseases or conditions (comorbidities) the patient had at hospital arrival that are known to increase the patient’s risk for readmission.

Complications

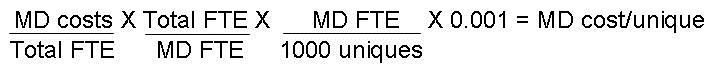
CMS calculates the rate for each complication by dividing the actual number of self-reported outcomes at each hospital by the number of eligible discharges for that measure at each hospital, multiplied by 1,000. The composite value reported on Hospital Compare is the weighted averages of the component indicators.  The measures of serious complications reported are risk adjusted to account for differences in hospital patients’ characteristics. In addition, the rates reported on Hospital Compare are “smoothed” to reflect the fact that measures for small hospitals are measured less accurately (i.e., are less reliable) than for larger hospitals.

CMS calculates the hospital acquired infection data from the claims hospitals submit to Medicare. The rate for each hospital acquired infection measure is calculated by dividing the number of infections that occur within any given eligible hospital by the number of eligible Medicare discharges, multiplied by 1,000. The hospital acquired infection rates were not risk adjusted by CMS.

In addition to the composite data, individual complications listed in the CMS database were examined (Table 1).

Table 1. Complications examined that are listed in CMS data base.

Objects Accidentally Left in the Body After Surgery

Air Bubble in the Bloodstream

Mismatched Blood Types

Severe Pressure Sores (Bed Sores)

Falls and Injuries

Blood Infection from a Catheter in a Large Vein

Infection from a Urinary Catheter

Signs of Uncontrolled Blood Sugar


Medicare Bonuses and Penalties

The CMS data was obtained from Kaiser Health News which had compiled the data into an Excel database (10).


Statistical Analysis

Data was reported as mean + standard error of mean (SEM). Outcomes between hospitals rated as better were compared to those of hospitals rated as average or worse using Student’s t-test. The relationship between continuous variables was obtained using the Pearson correlation coefficient. Significance was defined as p<0.05. All p values reported are nominal, with no correction for multiple comparisons.

Results

A large database was compiled for the CMS outcomes and each of the hospital ratings (Appendix 1). There were over 2500 hospitals listed in the database.

Mortality and Readmission Rates

A positive correlation for heart attack, heart failure and pneumonia was found between hospitals with better mortality rates (p<0.001 all comparisons). In other words, hospitals with better mortality rates for heart attack tended to be better mortality performers for heart failure and pneumonia, etc.  Surprisingly, the hospitals with better mortality rates for heart attack, heart failure and pneumonia had higher readmission rates for these diseases (p<0.001, all comparisons).

Examination of the association of Medicare bonuses and penalties with mortality rates revealed that the hospitals with better mortality rates for heart attacks, heart failure and pneumonia received the same compensation for value-based performance as hospitals with average or worse mortality rates (Appendix 2, p>0.05, all comparisons). However, these better hospitals had significantly larger penalties for readmission rates (Figure 1, p<0.0001, all comparisons). 


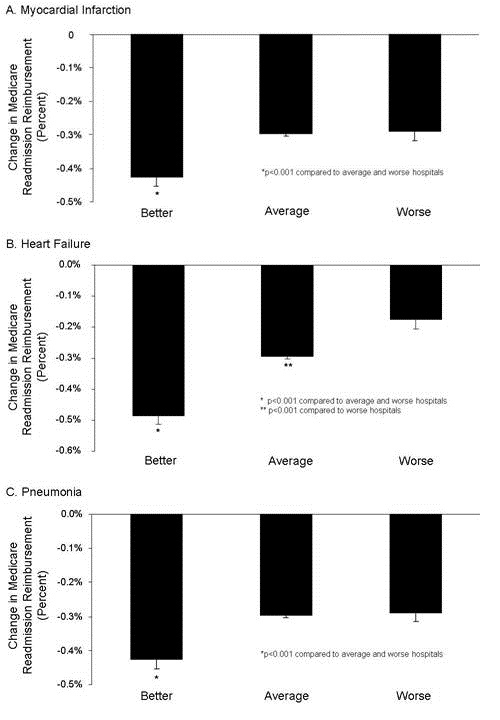
Figure 1.  Medicare bonuses and penalties for readmission rates of hospitals with better, average or worse mortality for myocardial infarction (heart attack, Panel A), heart failure (Panel B), and pneumonia (Panel C).

Because total Medicare penalties are the average of the adjustment for VBP and readmission rates, the reduction in reimbursement was reflected with higher total penalty rates for hospitals with better mortality rates for heart attacks, heart failure and pneumonia (Figure 2 , p<0.001, all comparisons).

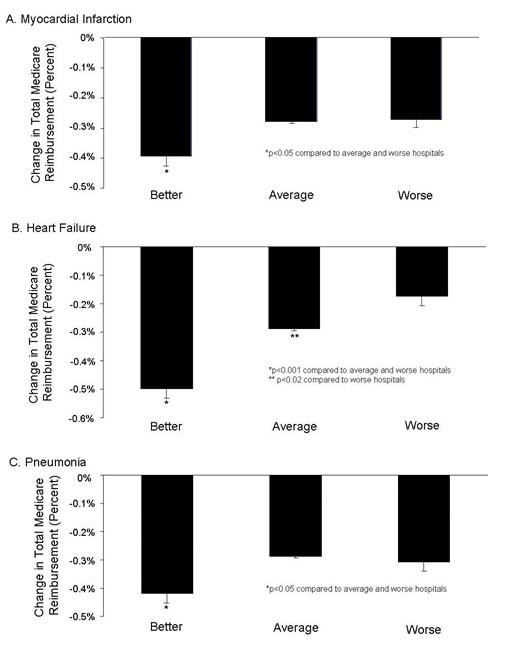
Figure 2.  Total Medicare bonuses and penalties for readmission rates of hospitals with better, average or worse mortality for myocardial infarction (heart attack, Panel A), heart failure (Panel B), and pneumonia (Panel C).

Mortality Rates and Complications

The rates of a number of complications are also listed in the CMS database (Table 1). A correlation was performed for each complication compared to the hospitals with better, average or worse death and readmission rates for heart attacks, heart failure and pneumonia (Appendix 3). A positive correlation of hospitals with better mortality rates was only observed for falls and injuries in the hospitals with better death rates from heart failure (p<0.02). However, severe pressure sores also differed in the hospitals with better mortality rates for heart attack and heart failure, but this was a negative correlation (p<0.05 both comparisons). In other words, hospitals that performed better in mortality performed worse in severe pressure sores. Similarly, hospitals with better mortality rates for heart failure had higher rates of blood infection from a catheter in a large vein compared to hospitals with an average mortality rate (p<0.001). None of the remaining complications differed.

Readmission Rates and Complications

A correlation was also performed between complications and hospitals with better, average and worse readmission rates for myocardial infarction, heart failure, and pneumonia (Appendix 4). Infections from a urinary catheter and falls and injuries were more frequent in hospitals with better readmission rates for myocardial infarction, heart failure, and pneumonia compared to hospitals with the worse readmission rates (p<0.02, all comparisons). Hospitals with better readmission rates for heart failure also had higher infections from a urinary catheter compared to hospitals with average readmission rates for heart failure (p<0.001). None of the remaining complications significantly differed 

Discussion

The use of “value-based performance” (VBP) has been touted as having the potential for improving care, reducing complications and saving money. However, we identified a negative correlation between deaths and readmissions, i.e., those hospitals with the better mortality rates were receiving larger financial penalties for readmissions and total compensation. Furthermore, correlations of hospitals with better mortality and readmission rates with complications were inconsistent.

Our data compliments and extends the observations of Krumholz et al. (11). These investigators examined the CMS database from 2005-8 for the correlation between mortality and readmissions. They identified an inverse correlation between mortality and readmission rates with heart failure but not heart attacks or pneumonia. However, with the financial penalties now in place for readmissions, it now seems likely hospital practices may have changed.

CMS compensating hospitals for lower readmission rates is disturbing since higher readmission rates correlated with better mortality. This equates to rewarding hospitals for practices leading to lower readmission rates but increase mortality. The lack of correlation for the other half of the payment adjustment, so called “value-based purchasing” is equally disturbing since if apparently has little correlation with patient outcomes.

Although there is an inverse correlation between mortality and readmissions, this does not prove cause and effect. The causes of the inverse association between readmissions and mortality rates are unclear, but the most obvious would be that readmissions may benefit patient survival. The reason for the lack of correlation between mortality and readmission rates with most complication rates is also unclear. VBP appears to rely heavily on complications that are generally infrequent and in some cases may be inconsequential. Furthermore, many of the complications are for all intents and purposes self-reported by the hospitals to CMS since they are based on claims data. However, the accuracy of these data has been called into question (12,13). Meddings et al. (13) studied urinary tract infections. According to Meddings, the data were “inaccurate” and not were “not valid data sets for comparing hospital acquired catheter-associated urinary tract infection rates for the purpose of public reporting or imposing financial incentives or penalties”. The authors proposed that the nonpayment by Medicare for “reasonably preventable” hospital-acquired complications resulted in this discrepancy. Inaccurate data may lead to the lack of correlation a complication and outcomes on the CMS database.

According to the CMS website the complications were chosen by “wide agreement from CMS, the hospital industry and public sector stakeholders such as The Joint Commission (TJC) , the National Quality Forum (NQF), and the Agency for Healthcare Research and Quality (AHRQ) , and hospital industry leaders” (7). However, some complications such as air bubble in the bloodstream or mismatched blood types are quite rare. Others such as signs of uncontrolled blood sugar are not evidence-based (14). Other complications actually correlated with improved mortality or readmission rates. It seems likely that some of the complications might represent more aggressive treatment or could reflect increased clinical care staffing which has previously been associated with better survival (14,15). 

There are several limitations to our data. First and foremost, the data are derived from CMS Hospital Compare where the data has been self-reported by hospitals. The validity and accuracy of the data has been called into question (12,13). Second, data are missing in multiple instances. For example, data from Maryland were not present. There were multiple instances when the data were “unavailable” or the “number of cases are too small”. Third, in some instances CMS did not report actual data but only higher, lower or no different from the National average. Fourth, much of the data are from surrogate markers, a fact which is puzzling when patient-centered outcomes are available. In addition, some of these surrogate markers have not been shown to correlate with outcomes.

It is unclear if CMS Hospital Compare should be used by patients or healthcare providers when choosing a hospital. At present it would appear that the dizzying array of data reported overrelies on surrogate markers which are possibly inaccurate. Lack of adequate outcomes data and even obfuscating the data by reporting the data as average, below or above average does little to help shareholders interpret the data. The failure to apparently incorporate mortality rates as a component of VBP is another major limitation. The accuracy of the data is also unclear. Until these shortcomings can be improved, we cannot recommend the use of Hospital Compare by patients or providers.

References

  1. Obama B. Securing the future of American health care. N Engl J Med. 2012; 367:1377-81.
  2. Showalter JW, Rafferty CM, Swallow NA, Dasilva KO, Chuang CH. Effect of standardized electronic discharge instructions on post-discharge hospital utilization. J Gen Intern Med. 2011;26(7):718-23.
  3. Heidenreich PA, Hernandez AF, Yancy CW, Liang L, Peterson ED, Fonarow GC. Get With The Guidelines program participation, process of care, and outcome for Medicare patients hospitalized with heart failure. Circ Cardiovasc Qual Outcomes. 2012 ;5(1):37-43.
  4. Hurley J, Garciaorr R, Luedy H, Jivcu C, Wissa E, Jewell J, Whiting T, Gerkin R, Singarajah CU, Robbins RA. Correlation of compliance with central line associated blood stream infection guidelines and outcomes: a review of the evidence. Southwest J Pulm Crit Care. 2012;4:163-73.
  5. Robbins RA, Gerkin R, Singarajah CU. Relationship between the Veterans Healthcare Administration Hospital Performance Measures and Outcomes. Southwest J Pulm Crit Care 2011;3:92-133.
  6. Padrnos L, Bui T, Pattee JJ, Whitmore EJ, Iqbal M, Lee S, Singarajah CU, Robbins RA. Analysis of overall level of evidence behind the Institute of Healthcare Improvement ventilator-associated pneumonia guidelines. Southwest J Pulm Crit Care. 2011;3:40-8.
  7. http://www.medicare.gov/HospitalCompare/Data/linking-quality-to-payment.aspx (accessed 4/8/13).
  8. http://www.medicare.gov/hospitalcompare/ (accessed 4/8/13).
  9. Fenton JJ, Jerant AF, Bertakis KD, Franks P. The cost of satisfaction: a national study of patient satisfaction, health care utilization, expenditures, and mortality. Arch Intern Med. 2012;172:405-11.
  10. http://capsules.kaiserhealthnews.org/wp-content/uploads/2012/12/Value-Based-Purchasing-And-Readmissions-KHN.csv (accessed 4/8/13).
  11. Krumholz HM, Lin Z, Keenan PS, Chen J, Ross JS, Drye EE, Bernheim SM, Wang Y, Bradley EH, Han LF, Normand SL. Relationship between hospital readmission and mortality rates for patients hospitalized with acute myocardial infarction, heart failure, or pneumonia. JAMA. 2013;309(6):587-93. doi: 10.1001/jama.2013.333.
  12. Robbins RA. The emperor has no clothes: the accuracy of hospital performance data. Southwest J Pulm Crit Care. 2012;5:203-5.
  13. Meddings JA, Reichert H, Rogers MA, Saint S, Stephansky J, McMahon LF. Effect of nonpayment for hospital-acquired, catheter-associated urinary tract infection: a statewide analysis. Ann Intern Med. 2012;157:305-12.
  14. NICE-SUGAR Study Investigators. Intensive versus conventional insulin therapy in critically ill patients. N Engl J Med. 2009;360:1283-97.
  15. Robbins RA, Gerkin R, Singarajah CU. Correlation between patient outcomes and clinical costs in the va healthcare system. Southwest J Pulm Crit Care. 2012;4:94-100.

Reference as: Robbins RA, Gerkin RD. Comparisons between Medicare mortality, morbidity, readmission and complications. Southwest J Pulm Crit Care. 2013;6(6):278-86. PDF

Friday
Apr062012

Correlation between Patient Outcomes and Clinical Costs in the VA Healthcare System

Richard A. Robbins, M.D.1

Richard Gerkin, M.D.2

Clement U. Singarajah, M.D.1

1Phoenix Pulmonary and Critical Care Medicine Research and Education Foundation and 2Banner Good Samaritan Medical Center, Phoenix, AZ


Abstract

Introduction: Increased nursing staffing levels have previously been associated with improved patient outcomes.  However, the effects of physician staffing and other clinical care costs on clinical outcomes are unknown.

Methods: Databases from the Department of Veterans Affairs were searched for clinical outcome data including 30-day standardized mortality rate (SMR), observed minus expected length of stay (OMELOS) and readmission rate. These were correlated with costs including total, drug, lab, radiology, physician (MD), and registered nurse (RN), other clinical personnel costs and non-direct care costs.

Results: Relevant data were obtained from 105 medical centers. Higher total costs correlated with lower intensive care unit (ICU) SMR (r=-0.2779, p<0.05) but not acute care (hospital) SMR. Higher costs for lab, radiology, MD and other direct care staff costs and total direct care costs correlated with lower ICU and acute care SMR (p<0.05, all comparisons). Higher RN costs correlated only with ICU SMR. None of the clinical care costs correlated with ICU or acute care OMELOS with the exception of higher MD costs correlating with longer OMELOS. Higher clinical costs correlated with higher readmission rates (p<0.05, all comparisons). Nonclinical care costs (total costs minus direct clinical care costs) did not correlate with any outcome.

Conclusions: Monies spent on clinical care generally improve SMR. Monies spent on nonclinical care generally do not correlate with outcomes.

Introduction

Previous studies have demonstrated that decreased nurse staffing adversely affects patient outcomes including mortality in some studies (1-5). However, these studies have been criticized because studies are typically cross-sectional in design and do not account for differences in patients’ requirements for nursing care. Other observers have asked whether differences in mortality are linked not to nursing but to unmeasured variables correlated with nurse staffing (6-9). In this context, we correlate mortality with costs associated with other clinical expenditures including drug, lab, radiology, physician (MD), and other clinical personnel costs.

The observed minus the expected length of stay (OMELOS) and readmission rates are two outcome measures that are thought to measure quality of care. It is often assumed that increased OMELOS or readmission rates are associated with increased expenditures (10,11). However, data demonstrating this association are scant. Therefore, we also examined clinical care costs with OMELOS and readmission rates.

Methods

The study was approved by the Western IRB.  

Hospital level of care. For descriptive purposes, hospitals were grouped into levels of care. These are classified into 4 levels: highly complex (level 1); complex (level 2); moderate (level 3), and basic (level 4). In general, level 1 facilities and some level 2 facilities represent large urban, academic teaching medical centers.

Clinical outcomes. SMR and OMELOS were obtained from the Inpatient Evaluation Center (IPEC) for fiscal year 2009 (12). Because this is a restricted website, the data for publication were obtained by a Freedom of Information Act (FOIA) request. SMR was calculated as the observed number of patients admitted to an acute care ward or ICU who died within 30 days divided by the number of predicted deaths for the acute care ward or ICU. Admissions to a VA nursing home, rehabilitation or psychiatry ward were excluded. Observed minus expected length of stay (OMELOS) was determined by subtracting the observed length of stay minus the predicted length of stay for the acute care ward or ICU from the risk adjusted length of stay model (12). Readmission rate was expressed as a percentage of patients readmitted within 30 days.

Financial data. Financial data were obtained from the VSSC menu formerly known as the klf menu.  Because this is also a restricted website, the data for publication were also obtained by a Freedom of Information Act (FOIA) request. In each case, data were expressed as costs per unique in order to compare expenditures between groups. MD and RN costs reported on the VSSC menu were not expressed per unique but only per full time equivalent employee (FTE). To convert to MD or RN cost per unique, the costs per FTE were converted to MD or RN cost per unique as below (MD illustrated):

Similarly, all other direct care personnel costs/unique was calculated as below:

Direct care costs were calculated as the sum of drug, lab, x-ray, MD, RN, and other direct care personnel costs. Non-direct care costs were calculated as total costs minus direct care costs.

Correlation of Outcomes with Costs. Pearson correlation coefficient was used to determine the relationship between outcomes and costs. Significance was defined as p<0.05.

Results

Costs: The average cost per unique was $6058. Direct care costs accounted for 53% of the costs while non-direct costs accounted for 47% of the costs (Table 1 and Appendix 1).

Table 1. Average and percent of total costs/unique.

Hospital level. Data were available from 105 VA medical centers with acute care wards and 98 with ICUs. Consistent with previous data showing improved outcomes with larger medical centers, hospitals with higher levels of care (i.e. hospitals with lower level numbers) had decreased ICU SMR (Table 2). Higher levels of care also correlated with decreased ICU OMELOS and readmission rates (Table 2). For full data and other correlations see Appendix 1.

Table 2. Hospital level of care compared to outcomes. Lower hospital level numbers represent hospitals with higher levels of care.


*p<0.05

SMR. Increased total costs correlated with decreased intensive care unit (ICU) SMR (Table 3, r=-0.2779, p<0.05) but not acute care (hospital) SMR. Increased costs for lab, radiology, MD and other direct care staff costs and total direct care costs also correlated with decreased SMR for both ICU and acute care SMR (p<0.05, all comparisons). However, drug costs did not correlate with either acute care or ICU SMR. Increased RN costs correlated with improved ICU SMR but not acute care SMR. For full data and other correlations see Appendix 1.

Table 3. Correlation of SMR and costs.

*p<0.05

OMELOS. There was no correlation between SMR and OMELOS for either acute care (r= -0.0670) or ICU (r= -0.1553). There was no correlation between acute care or ICU OMELOS and clinical expenditures other than higher MD costs positively correlated with increased OMELOS (Table 4, p<0.05, both comparisons).

Table 4. Correlation of OMELOS and costs

*p<0.05

Readmission rate. There was no correlation between readmission rates and acute care SMR (r= -0.0074) or ICU SMR (r= 0.0463).Total and all clinical care costs directly correlated with readmission rates while non-direct clinical care costs did not (Table 5).

Table 5.Correlation of readmission rates and costs.

*p<0.05

Discussion

The data in this manuscript demonstrate that most clinical costs are correlated with a decreased or improved SMR Only MD costs correlate with OMELOS but all clinical costs directly correlate with increased readmission rates. However, non-direct care costs do not correlate with any clinical outcome.

A number of studies have examined nurse staffing.  Increased nurse staffing levels are associated with improved outcomes, including mortality in some studies (1-5). The data in the present manuscript confirm those observations in the ICU but not for acute care (hospital). However, these data also demonstrate that higher lab, X-ray and MD costs also correlate with improved SMR. Interestingly, the strongest correlation with both acute care and ICU mortality was MD costs. We speculate that these observations are potentially explained that with rare exception, nearly all physicians see patients in the VA system. The same is not true for nurses. A number of nurses are employed in non-patient care roles such as administration, billing, quality assurance, etc. It is unclear to what extent nurses without patient care responsibilities were included in the RN costs.

These data support that readmission rates are associated with higher costs but do not support that increased OMELOS is associated with higher costs implying that efforts to decrease OMELOS may be largely wasted since they do not correlate with costs or mortality. It is unclear whether the increased costs with readmissions are because readmissions lead to higher costs or the higher clinical care costs cause the higher readmissions, although the former seem more likely.

These data are derived from the VA, the Nation’s largest healthcare system. The VA system has unique features and actual amounts spent on direct and non-direct clinical care may differ from other healthcare systems. There may be aspects of administrative costs that are unique to the VA system, although it is very likely there is applicability of these findings to other healthcare systems. 

A major weakness of these data is that it is self reported. Data reported to central reporting agencies may be confusing with overlapping cost centers. Furthermore, personnel or other costs might be assigned to inappropriate cost centers in order to meet certain administrative goals. For example, 5 nurses and 1 PhD scientist were assigned to the pulmonary clinic at the Phoenix VA Medical Center while none performed any services in that clinic (Robbins RA, unpublished observations). These types of errors could lead to inaccurate or inappropriate conclusions after data analysis.

A second weakness is that the observational data reported in this manuscript are analyzed by correlation.  Correlation of decreased clinical care spending with increased mortality does not necessarily imply causation (13). For example, clinical costs are increased with readmission rates. However, readmission rates may also be higher with sicker patients who require readmission more frequently. The increased costs could simply represent the higher costs of caring for sicker patients.

A third weakness is that non-direct care costs are poorly defined by these databases. These costs likely include such essential services as support service personnel, building maintenance, food preparation, utilities, etc. but also include administrative costs. Which of these services account for variation in non-direct clinical costs is unknown. However, administrative efficiency is known to be poor and declining in the US, with increasing numbers of administrators leading to increasing administrative costs (14).

A number of strategies to control medical expenditures have been initiated, although these have almost invariably been directed at clinical costs. Programs designed to limit clinical expenditures such as utilization reviews of lab or X-ray expenditures or decreasing clinical MD or RN personnel have become frequent.  Even if costs are reduced, the present data imply that these programs may adversely affect patient mortality, suggesting that caution in limiting clinical expenses are needed. In addition, programs have been initiated to reduce both OMELOS and readmission rates. Since neither costs nor mortality correlate with OMELOS, these data imply that programs focusing on reducing OMELOS are unlikely to be successful in improving mortality or in reducing costs.

Non-direct patient care costs accounted for nearly half of the total healthcare costs in this study. It is unknown which cost centers account for variability in non-clinical areas. Since non-direct care costs do not correlate with outcomes, focus on administrative efficiency could be a reasonable performance measure to reduce costs. Such a performance measure has been developed by the Inpatient and Evaluation Center at the VA (15). This or similar measures should be available to policymakers to provide better care at lower costs and to incentivize administrators to adopt practices that lead to increased efficiency.

References

  1. Needleman J, Buerhaus P, Mattke S, Stewart M, Zelevinsky K. Nurse-staffing levels and the quality of care in hospitals. N Engl J Med 2002;346:1715-22.
  2. Aiken LH, Clarke SP, Sloane DM, Sochalski J, Silber JH. Hospital nurse staffing and patient mortality, nurse burnout, and job dissatisfaction. JAMA 2002;288:1987-93.
  3. Aiken LH, Cimiotti JP, Sloane DM, Smith HL, Flynn L, Neff DF. Effects of nurse staffing and nurse education on patient deaths in hospitals with different nurse work environments. Med Care 2011;49:1047-53.
  4. Diya L, Van den Heede K, Sermeus W, Lesaffre E. The relationship between in-hospital mortality, readmission into the intensive care nursing unit and/or operating theatre and nurse staffing levels. J Adv Nurs 2011 Aug 25. doi: 10.1111/j.1365-2648.2011.05812.x. [Epub ahead of print]
  5. Cho SH, Hwang JH, Kim J. Nurse staffing and patient mortality in intensive care units. Nurs Res 2008;57:322-30.
  6. Volpp KG, Rosen AK, Rosenbaum PR, Romano PS, Even-Shoshan O, Canamucio A, Bellini L, Behringer T, Silber JH. Mortality among patients in VA hospitals in the first 2 years following ACGME resident duty hour reform. JAMA 2007;298:984-92.
  7. Lagu T, Rothberg MB, Nathanson BH, Pekow PS, Steingrub JS, Lindenauer PK. The relationship between hospital spending and mortality in patients with sepsis. Arch Intern Med 2011;171:292-9.
  8. Cleverley WO, Cleverley JO. Is there a cost associated with higher quality? Healthc Financ Manage 2011;65:96-102.
  9. Chen LM, Jha AK, Guterman S, Ridgway AB, Orav EJ, Epstein AM. Hospital cost of care, quality of care, and readmission rates: penny wise and pound foolish? Arch Intern Med 2010;170:340-6.
  10. Render ML, Almenoff P. The veterans health affairs experience in measuring and reporting inpatient mortality. In Mortality Measurement. February 2009. Agency for Healthcare Research and Quality, Rockville, MD. http://www.ahrq.gov/qual/mortality/VAMort.htm
  11. Jencks SF, Williams MV, Coleman EA. Rehospitalizations among patients in the Medicare fee-for-service program. N Engl J Med;360:1418-28.
  12. Render ML, Kim HM, Deddens J, Sivaganesin S, Welsh DE, Bickel K, Freyberg R, Timmons S, Johnston J, Connors AF Jr, Wagner D, Hofer TP. Variation in outcomes in Veterans Affairs intensive care units with a computerized severity measure. Crit Care Med 2005;33:930-9.
  13. Aldrich J. Correlations genuine and spurious in Pearson and Yule. Statistical Science 1995;10:364-76.
  14. Woolhandler S, Campbell T, Himmelstein DU. Health care administration in the United States and Canada: micromanagement, macro costs. Int J Health Serv. 2004;34:65-78.
  15. Gao J, Moran E, Almenoff PL, Render ML, Campbell J, Jha AK. Variations in efficiency and the relationship to quality of care in the Veterans health system. Health Aff (Millwood) 2011;30:655-63.

Click here for Appendix 1.

Reference as: Robbins RA, Gerkin R, Singarajah CU. Correlation between patient outcomes and clinical costs in the va healthcare system. Southwest J Pulm Crit Care 2012;4:94-100. (Click here for a PDF version)