Search Journal-type in search term and press enter
Southwest Pulmonary and Critical Care Fellowships
In Memoriam

General Medicine

(Click on title to be directed to posting, most recent listed first)

Infectious Diseases Telemedicine to the Arizona Department of Corrections
   During SARS-CoV-2 Pandemic. A Short Report.
The Potential Dangers of Quality Assurance, Physician Credentialing and
   Solutions for Their Improvement (Review)
Results of the SWJPCC Healthcare Survey
Who Are the Medically Poor and Who Will Care for Them?
Tacrolimus-Associated Diabetic Ketoacidosis: A Case Report and Literature 
   Review
Nursing Magnet Hospitals Have Better CMS Hospital Compare Ratings
Publish or Perish: Tools for Survival
Is Quality of Healthcare Improving in the US?
Survey Shows Support for the Hospital Executive Compensation Act
The Disruptive Administrator: Tread with Care
A Qualitative Systematic Review of the Professionalization of the 
   Vice Chair for Education
Nurse Practitioners' Substitution for Physicians
National Health Expenditures: The Past, Present, Future and Solutions
Credibility and (Dis)Use of Feedback to Inform Teaching : A Qualitative
Case Study of Physician-Faculty Perspectives
Special Article: Physician Burnout-The Experience of Three Physicians
Brief Review: Dangers of the Electronic Medical Record
Finding a Mentor: The Complete Examination of an Online Academic 
   Matchmaking Tool for Physician-Faculty
Make Your Own Mistakes
Professionalism: Capacity, Empathy, Humility and Overall Attitude
Professionalism: Secondary Goals 
Professionalism: Definition and Qualities
Professionalism: Introduction
The Unfulfilled Promise of the Quality Movement
A Comparison Between Hospital Rankings and Outcomes Data
Profiles in Medical Courage: John Snow and the Courage of
   Conviction
Comparisons between Medicare Mortality, Readmission and
   Complications
In Vitro Versus In Vivo Culture Sensitivities:
   An Unchecked Assumption?
Profiles in Medical Courage: Thomas Kummet and the Courage to
   Fight Bureaucracy
Profiles in Medical Courage: The Courage to Serve
and Jamie Garcia
Profiles in Medical Courage: Women’s Rights and Sima Samar
Profiles in Medical Courage: Causation and Austin Bradford Hill
Profiles in Medical Courage: Evidence-Based 
Medicine and Archie Cochrane
Profiles of Medical Courage: The Courage to Experiment and 
   Barry Marshall
Profiles in Medical Courage: Joseph Goldberger,
   the Sharecropper’s Plague, Science and Prejudice
Profiles in Medical Courage: Peter Wilmshurst,
   the Physician Fugitive
Correlation between Patient Outcomes and Clinical Costs
   in the VA Healthcare System
Profiles in Medical Courage: Of Mice, Maggots 
   and Steve Klotz
Profiles in Medical Courage: Michael Wilkins
   and the Willowbrook School
Relationship Between The Veterans Healthcare Administration
   Hospital Performance Measures And Outcomes 


Although the Southwest Journal of Pulmonary and Critical Care was started as a pulmonary/critical care/sleep journal, we have received and continue to receive submissions that are of general medical interest. For this reason, a new section entitled General Medicine was created on 3/14/12. Some articles were moved from pulmonary to this new section since it was felt they fit better into this category.

-------------------------------------------------------------------------------------

Entries in mortality (5)

Monday
Oct172022

The Potential Dangers of Quality Assurance, Physician Credentialing and Solutions for Their Improvement

Richard A. Robbins, MD

Phoenix Pulmonary and Critical Care Research and Education Foundation

Gilbert, AZ USA

Abstract

The Institute of Medicine defines health care quality as "the degree to which health care services for individuals and populations increase the likelihood of desired health outcomes and are consistent with current professional knowledge”. However, defining which are the desired outcomes and current professional knowledge can be controversial. In this review article the effectiveness of quality assurance is reviewed along with pointing out some of the dangers to physicians. Since deficient quality assurance can affect credentialing, solutions for the problem are offered including an independent medical staff and election rather than appointment of the chief of staff. Solutions to expedite and ensure accuracy in credentialing are offered including use of the Interstate Medical Licensure Compact (IMLC). These solutions should lead to improved and fairer quality assurance, reduced administrative expenses, decreased fraud, and modernization of physician licensing and credentialing.

Introduction

In 2013 the Southwest Journal of Pulmonary and Critical Care published a review of the history of the quality movement and quality improvement programs (quality assurance, QA) by major healthcare regulatory organizations including the Joint Commission, Institute for Healthcare Improvement, Department of Veterans Affairs, Institute of Medicine, and the Department of Health and Human Services (1). The review concluded that their measures were flawed. Although patient-centered outcomes were initially examined, these were replaced with surrogate markers. Many of the surrogate markers were weakly or nonevidence-based interventions. Furthermore, the surrogate markers were often “bundled”, some evidence-based and some not. These guidelines, surrogate markers and bundles were rarely subjected to beta testing. When carefully scrutinized, the guidelines rarely correlated with improved patient-centered outcomes. Based on this lack of improvement in outcomes, the article concluded that the quality movement had not improved healthcare. 

Nearly all quality assurance articles state that playing the “blame game” where blame a person or group of people for a bad outcome is counterproductive. However, most QA programs do exactly that (2). Physicians are often bear the brunt of the blame. Witness the National Practitioner Data Bank which is little more than a physician blacklist (3). Most QA reviews point out the importance of obtaining physician buy in of the process (2). Yet most QA programs are run by nonphysicians and overseen by hospital administrators. Not surprisingly such a process has been used as a means of controlling physicians and squelching any dissent. This manuscript was undertaken as a follow-up and to point out any potential dangers of quality assurance. It seems to reinforce the principle that “not everything that counts can be counted, and not everything that can be counted counts” (4).

New Data on Quality Assurance Leading to Improvements in Patient Outcomes

There are few manuscripts that show definitive improvement in patient outcomes and many continue to use mostly meaningless metrics. However, a recent project by the Mayo Clinic is a notable exception (5). Faced with a six-quarter rise in the observed/expected inpatient mortality ratio, physicians prospectively studied a multicomponent intervention. The project leadership team attempted to implement standardized system-wide improvements while allowing individual hospitals to simultaneously pursue site-specific practice redesign opportunities. System-wide mortality was reduced from 1.78 to 1.53 (per 100 admissions; p = .01). Although the actual plan implemented was somewhat vague, it is clear that the project was physician led and was not associated with affixing blame to any physician or group of physicians. However, it may be that the program did little more than decrease the number of admissions that were at high risk for death which can lead to reduced standardized mortality (5).

Dangers of Quality Assurance

Young physicians need to be aware of the dangers of quality assurance. Although seminal publications such as “To Err Is Human” (2) often point out that efforts to fix blame rather than analyze errors are counter-productive, experience indicates that is often what is done. Medicine is rarely practiced by a sole practitioner and should patient care result in a bad outcome, the physician least valued by administration is probably who will be blamed. I would advise young physicians to be wary of admitting any wrongdoing and seeking legal counsel when appropriate. Chiefs of staff (COS) which used to be elected from the active medical staff are now appointed and serve their administrative masters rather than the medical staff they represent in name only. Furthermore, their lack of understanding of statistics, and in some cases medicine, can make their actions dangerous. In many instances they are not interested in reasoning or explanation but in action to make the “numbers right”. Any explanation is often viewed as a mere excuse for poor performance.

Below are some examples of quality assurance being used for physician control rather than improving care. These dangers are not mentioned in reviews of QA. I personally have witnessed each and remain concerned that we perpetuate the notion that quality assurance is a positive thing that “weeds out” bad physicians. As physicians are increasingly employed by hospitals, this may become more of a problem.

Mortality

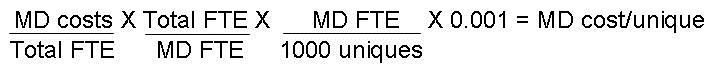
Mortality rates, especially in small population areas of the hospital are particularly subject to manipulation. For example, a small ICU might admit some patients more appropriately cared for in a hospice. If this care results in 1 or 2 excess deaths in a month because of these inappropriate admissions, the standardized mortality for a small ICU can easily rise above 1.2 (number of deaths/expected deaths) which is usually used as a cutoff for excess mortality (6,7). If 1 or 2 doctors are responsible for these patients, a superficial review might conclude that poor care resulted in the excess deaths. At the Phoenix VA we were faced with a high mortality  in the ICU. In those days the ICU was used as a hospice because of understaffing of some medicine floors making quality care for dying patients difficult. By denying admission of those patients to the ICU, we were able to reduce ICU mortality to acceptable standards (Robbins RA, unpublished observations).

Similar principles can be applied to surgical or procedure mortality. Administrators have been known to scrutinize surgical mortality or focus on complications which may or may not have arisen from the operation as excuses for replacing or restricting physicians. My personal examples include examining the outcomes of a thoracic surgeon who operated at multiple hospitals. Because one hospital wanted more operations done at their hospital, a review of surgical mortality was initiated with the idea that the physician could be replaced with a physician willing to do the bulk of their operations at the review requesting hospital.

Hospital Readmissions

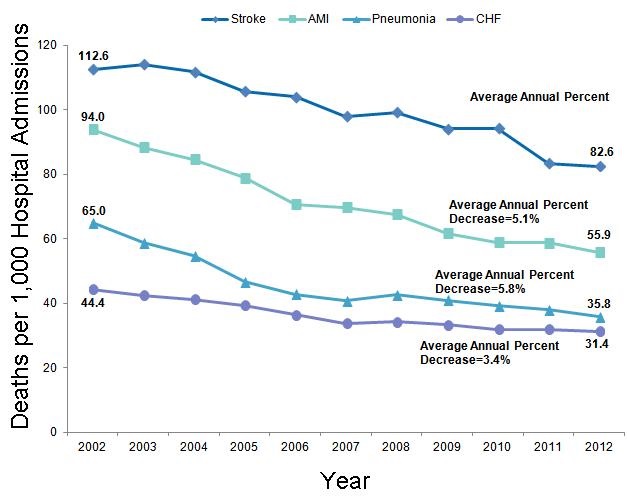
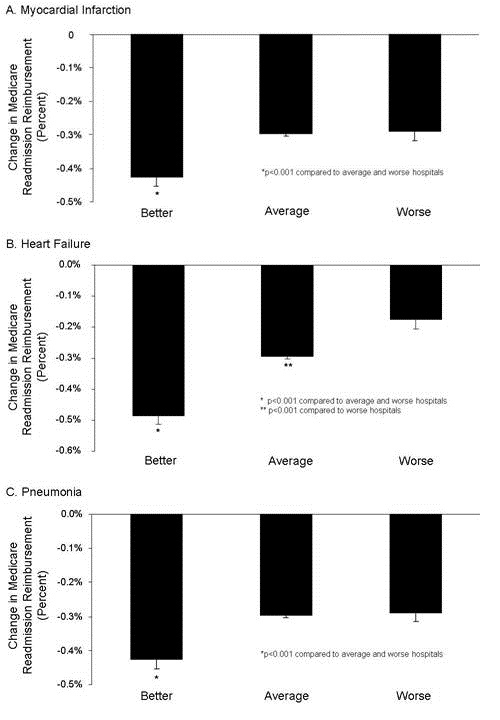
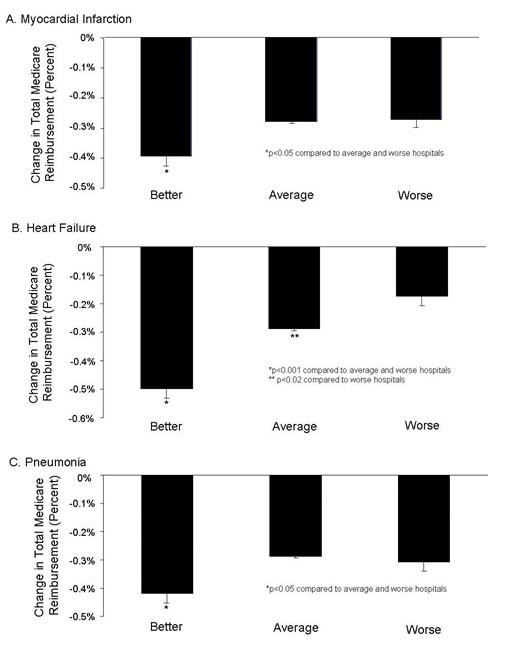
Reduction in hospital readmission has been touted not only as a quality measure, but also in reducing healthcare costs. The Affordable Care Act (ACA) established the Hospital Readmission Reduction Program (HRRP) in 2012. Under this program, hospitals are financially penalized if they have higher than expected risk-standardized 30-day readmission rates for acute myocardial infarction, heart failure, and pneumonia. The HRRP has garnered significant attention. However, readmissions are sometimes quite appropriate. The HRRP has shown that readmissions have decreased but at the cost of higher mortality at least for some common conditions including pneumonia, myocardial infarction and heart failure (8,9).

Hospital-Acquired Infections

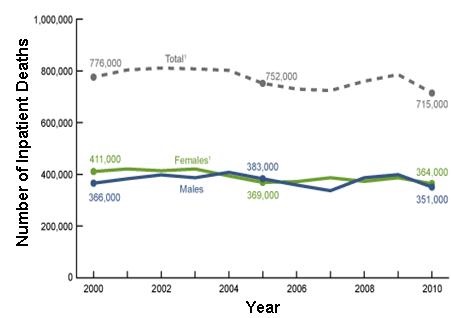
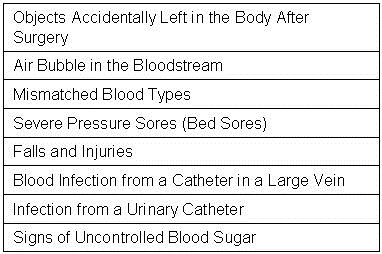
It has long been known that hospital-acquired infections are the final cause of death in many severely ill patients (10). Patients cared for several days to weeks in the ICU often develop line sepsis, ventilator-associated pneumonia, or catheter-associated urinary tract infections. How to prevent these infections is unclear (1). Nevertheless, CMS initiated the Hospital-Acquired Condition Reduction Program. With their usual definiteness, CMS announced that their program had saved 8000 lives and reduced expenditures by 2.9 billion dollars (11). However, these claims are based on extrapolated data and there appears to be no data that inpatient hospital deaths declined or that expenditures decreased. Some explanation illustrated by the following example is probably appropriate. Suppose a patient with advanced lung cancer is admitted to the ICU and intubated while awaiting chemo or immunotherapy. However, the therapy is ineffective and after 7 days the patient succumbs to an apparent ventilator-associated pneumonia (VAP). Under CMS data the patient would not die if they had not developed pneumonia which is clearly not true. This and similar extrapolations make the CMS data unreliable.

At the Phoenix VA ICU, we had a high incidence of VAP almost certainly because we were very aggressive in diagnosis. We would do bronchoscopy with bronchoalveolar lavage and quantitative cultures to diagnose ventilator-associated pneumonia (12). However, rather than our efforts being acknowledged we were threatened because our high incidence of VAP combined with our high mortality only illustrated that we were “bad” physicians according to the then COS, Raymond Chung. He brought in an outside  consultant who advised us to do tight control of glucose which would have further increased our mortality (13). We resolved the problems by decreasing the use of the ICU as a hospice as previously mentioned and by eliminating the diagnosis of VAP in the ICU. We simply quit doing bronchoscopy with BAL for diagnosis of VAP and forbade our students, residents and fellows from mentioning VAP in their notes. Our VAP rate went to zero.

Patient Wait Times

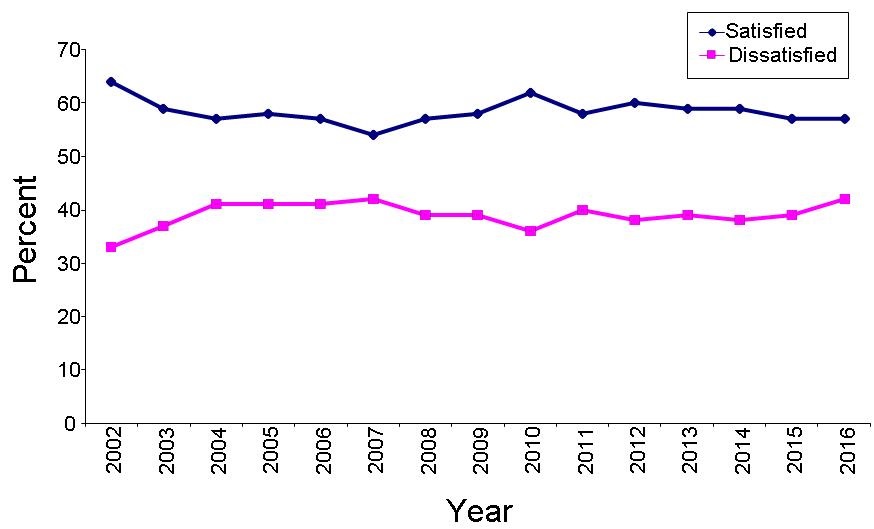
The falsification of wait times by the Department of Veterans Affairs has been well documented (14). What is less well known is that over 70% of Veterans Affairs medical centers participated in this fraud (15). What is not discussed is that VA administrators were well aware that they were falling short and assigning more patients to providers than their guidelines direct. Furthermore, when the scandal became apparent, they tried to blame long wait times on “lazy doctors” (16). At the epicenter of the wait scandal the COS at the Phoenix VA, Raymond Chung, had been aware of long wait times but kept physicians ignorant of the extent of the problem. Furthermore, in the pulmonary and critical care section the percentage of our patients waiting over 14 days was very small (<1%) and most were due to patient requests (Robbins RA, unpublished observations). However, Dr. Chung wanted to hold meetings with me to discuss the poor performance of the pulmonary and critical care section until we were started publishing our results in an email form and comparing them to other sections.

Challenging the Hospital Administration

The sad tale of how the firing of the night time janitor led to a maggot infestation at the Kansas City VA is well documented (17). What is not as well documented is what happened in the aftermath. The hospital director who fired the janitor, Hugh Doran, had already resigned from the VA because of a scandal involving him soliciting prostitution on “John TV”. However, his colleagues apparently took exception to Dr. Steve Klotz publishing his investigation of the maggot infestation in a scientific journal (18). Dr. Klotz’s Merit Review which he held for over 20 years was not renewed and he left the VA heading the HIV clinic at the University of Arizona and eventually becoming head of the infectious disease section.

Solutions

Quality assurance should be the function of an independent medical staff. Businessmen are not trained in medicine, have no practical medical experience and do not have the statistical background to determine sources of problems or the best remedies to care-related problems. The medical staff needs to be independent. A medical staff hired by the hospital most likely serves the financial concerns of the hospital administration.

Chief of Staff

The COS should be involved in the quality assurance process but only if they clearly serve the patient and the medical staff. The COS is now either appointed or approved by the hospital administration. They are no longer the doctors’ representative to the hospital administration but rather the hospital administration’s representative to the doctors. The concept that the COS can work in a “kumbaya” relationship with hospital administrators is a naive remanent of a bygone era. Although a good working relationship may exist in some healthcare organizations, the increasing numbers of suits by physicians suggests it is no longer a given that the doctors and the hospital administration work together. Furthermore, as illustrated by the examples above, the administration cannot be trusted to be fair to the individual physician.

Credentialing

Similar to QA, credentialing should be a function of the medical staff. Credentialing is the process by which the education, training, licensure, registrations and certifications, sanctions, as well as work history, including malpractice litigation, are documented and approved by the medical facility where the physician intends to provide care. In the credentialing process, many of the same documents required for state licensure are reverified; recredentialing must be periodically performed, up to every 3 years, with elements subject to change reverified. The COVID-19 pandemic has shown how that the status of our current state licensure and individual hospital credentialing procedures is unwieldly and painfully slow (19). During the pandemic various states were in desperate need of additional physicians to care for critically ill patients. Because physician licensure is by state, states had to waive this requirement to hire physicians licensed in other states. In addition, hospitals had to implement their disaster plans to streamline credentialing requirements to bring on additional physicians whether from in-state or out-of-state.

By allowing physicians licensed in one state to practice in another, and using disaster credentialing standards, NYC Health + Hospitals was able to staff up to meet urgent needs during the pandemic (20). To strengthen the ability of the US to respond to future crises, better allocate medical personnel to areas of need and also reduce administrative costs, permanent ways of enabling physicians to practice in any state are needed, such as a national physician license. The requirements for obtaining a state license are essentially the same (i.e., graduation from medical school and passage of a federal licensure test) across the country (19). Also, although there are regional differences in medical care, they are not by design. The Department of Veterans Affairs already accepts any valid state license to practice in any of its facilities (federal laws supersede state laws) and the system works well. Nonetheless, state licensure has deep roots in the tenth amendment of the Constitution, provides revenue to state governments and medical boards, and at times seeks to prevent competition from related health professions (19).

Given that a national license is not imminent, Mullangi et al. (20) have proposed a good intermediate step: build on the Interstate Medical Licensure Compact (IMLC). At present, more than 25 states have joined the compact and agreed to the same licensure requirements and to accept each other’s review of the applicants (21). If the federal government were to require all states to join the compact, a licensed physician could expediently obtain a new state license as opposed to each state medical board verifying credentials as well as other requirements).

However, even if the US had a national physician license at the time that COVID-19 hit, hospitals would still have had to invoke their disaster plans to waive usual credentialing processes and immediately employ the physicians needed to staff for the pandemic. A key obstacle with credentialing is the requirement that each entity (hospitals and insurance plans) independently verifies credentials. In practical terms, no matter how many hospitals a physician has worked in, no matter how many states in which he or she holds a medical license in good standing, no matter how many insurance plans have previously enrolled the physician, each hospital or insurance plan must independently verify the credentials. It is this redundancy that causes the long delays between when a physician accepts a position and when he or she can begin work and/or bill for services. Health care networks sharing credentialing elements among its member facilities.

A more robust method for reducing inefficiencies and increasing accountability in medical credentialing is to have a single, National source physician credentialing. At present, there are limited efforts in this direction. There are already a number of repositories to verify medical credentials in full or part including The Federation of State Medical Boards the Drug Enforcement Administration, the American Medical Association, the National Practitioner Data Bank and many credential verification organizations that will check credentials for a price to name just a few.

Implementing these proposals would not necessarily require a government subsidy. Individual physicians could pay to register in exchange for not having to submit their materials and medical education and practice histories multiple times. Hospitals and insurers could pay to access the system. Having a single national repository would not only smooth staffing burdens during either a pandemic or normal operations, but has been estimated to save more than $1 billion annually. Potentially, to be verified physicians would not even need to fill out forms with their professional information. Once their identity was confirmed, information would simply be downloaded onto a common form from the database.

Conclusions

There are numerous dangers to physicians in the QA process because the process is controlled by unqualified administrators unfamiliar with medical practice. Making QA a function of an independent medical staff rather than the hospital administration could potentially resolve many of these dangers. The COVID-19 pandemic has shown that the current US system of state licensure and hospital-based credentialing precludes the rapid hiring and credentialing of physicians. These experiences suggest solutions to more rapidly and flexibly deploy our physician workforce, decrease delays and administrative expenses, reduce fraud, and modernize physician licensing and credentialing.

References

  1. Robbins RA. The unfulfilled promise of the quality movement. Southwest J Pulm Crit Care. 2014;8(1):50-63. [CrossRef]
  2. Institute of Medicine (US) Committee on Quality of Health Care in America. To Err is Human: Building a Safer Health System. Kohn LT, Corrigan JM, Donaldson MS, editors. Washington (DC): National Academies Press (US); 2000. [PubMed]
  3. Health Resources and Services Administration (HRSA), HHS. National Practitioner Data Bank for Adverse Information on Physicians and Other Health Care Practitioners: reporting on adverse and negative actions. Final rule. Fed Regist. 2010 Jan 28;75(18):4655-82. [PubMed]
  4. Mason D. Not Everything That Counts Can be Counted. Nov 12, 2013. Available at: https://medium.com/@visualizechange/not-everything-that-counts-can-be-counted-8cdeb6deafe8 (accessed 10/16/22).
  5. Mueller JT, Thiemann KMB, Lessow C, Murad MH, Wang Z, Santrach P, Poe J. The Mayo Clinic Hospital Mortality Reduction Project: Description and Results. J Healthc Manag. 2020 Mar-Apr;65(2):122-132. [CrossRef] [PubMed]
  6. Pollock BD, Herrin J, Neville MR, Dowdy SC, Moreno Franco P, Shah ND, Ting HH. Association of Do-Not-Resuscitate Patient Case Mix With Publicly Reported Risk-Standardized Hospital Mortality and Readmission Rates. JAMA Netw Open. 2020 Jul 1;3(7):e2010383. [CrossRef] [PubMed]
  7. Nicholls A. The Standardised Mortality Ratio and How to Calculate It. August 26, 2020. Available at: https://s4be.cochrane.org/blog/2020/08/26/the-standardised-mortality-ratio-and-how-to-calculate-it/ (accessed 9/15/22).
  8. Robbins RA, Gerkin RD. Comparisons between Medicare mortality, morbidity, readmission and complications. Southwest J Pulm Crit Care. 2013;6(6):278-86.
  9. Gupta A, Fonarow GC. The Hospital Readmissions Reduction Program-learning from failure of a healthcare policy. Eur J Heart Fail. 2018 Aug;20(8):1169-1174. [CrossRef] [PubMed]
  10. Feingold DS. Hospital-acquired infections. N Engl J Med. 1970 Dec 17;283(25):1384-91. [CrossRef] [PubMed]
  11. CMS. Declines in Hospital-Acquired Conditions Save 8,000 Lives and $2.9 Billion in Costs. Jun 05, 2018. Available at: https://www.cms.gov/newsroom/press-releases/declines-hospital-acquired-conditions-save-8000-lives-and-29-billion-costs (accessed 9/24/22).
  12. Horonenko G, Hoyt JC, Robbins RA, Singarajah CU, Umar A, Pattengill J, Hayden JM. Soluble triggering receptor expressed on myeloid cell-1 is increased in patients with ventilator-associated pneumonia: a preliminary report. Chest. 2007 Jul;132(1):58-63. [CrossRef] [PubMed]
  13. NICE-SUGAR Study Investigators, Finfer S, Chittock DR, Su SY, Blair D, Foster D, Dhingra V, Bellomo R, Cook D, Dodek P, Henderson WR, Hébert PC, Heritier S, Heyland DK, McArthur C, McDonald E, Mitchell I, Myburgh JA, Norton R, Potter J, Robinson BG, Ronco JJ. Intensive versus conventional glucose control in critically ill patients. N Engl J Med. 2009 Mar 26;360(13):1283-97. [CrossRef] [PubMed]
  14. Oppel RA Jr, Shear MD. Severe Report Finds V.A. Hid Waiting Lists at Hospitals. NY Times. May 28, 2014. Available at: https://www.nytimes.com/2014/05/29/us/va-report-confirms-improper-waiting-lists-at-phoenix-center.html (accessed 9/30/22).
  15. Office of VA Inspector General. Review of alleged patient deaths, patient wait times, and scheduling practices at the Phoenix VA health care system. Available at: http://www.va.gov/oig/pubs/VAOIG-14-02603-267.pdf (accessed 9/30/22).
  16. Robbins RA. Patient deaths blamed on long waits at the Phoenix VA. Southwest J Pulm Crit Care. 2014;8(4):227-8. [CrossRef]
  17. Robbins RA. Profiles in medical courage: of mice, maggots and Steve Klotz. Southwest J Pulm Crit Care 2012;4:71-7. Available at: https://www.swjpcc.com/general-medicine/2012/3/30/profiles-in-medical-courage-of-mice-maggots-and-steve-klotz.html (accessed 9/26/22).
  18. Beckendorf R, Klotz SA, Hinkle N, Bartholomew W. Nasal myiasis in an intensive care unit linked to hospital-wide mouse infestation. Arch Intern Med. 2002 Mar 25;162(6):638-40. [CrossRef] [PubMed]
  19. Bell DL, Katz MH. Modernize Medical Licensing, and Credentialing, Too—Lessons From the COVID-19 Pandemic. JAMA Intern Med. 2021;181(3):312–315. [CrossRef] [PubMed]
  20. Mullangi S, Agrawal M, Schulman K. The COVID-19 Pandemic-An Opportune Time to Update Medical Licensing. JAMA Intern Med. 2021 Mar 1;181(3):307-308. [CrossRef] [PubMed]
  21. Steinbrook R. Interstate medical licensure: major reform of licensing to encourage medical practice in multiple states. JAMA. 2014;312(7):695-696. [CrossRef] [PubMed]

Cite as: Robbins RA. The Potential Dangers of Quality Assurance, Physician Credentialing and Solutions for Their Improvement. Southwest J Pulm Crit Care Sleep. 2022;25(4):52-58. doi: https://doi.org/10.13175/swjpccs044-22 PDF 

Tuesday
Jan172017

Is Quality of Healthcare Improving in the US?

Richard A. Robbins, MD

Phoenix Pulmonary and Critical Care Research and Education Foundation

Gilbert, AZ USA


Abstract

Politicians and healthcare administrators have touted that under their leadership enormous strides have been made in the quality of healthcare. However, the question of how to measure quality remains ambiguous. To demonstrate improved quality that is meaningful to patients, outcomes such as life expectancy, mortality, and patient satisfaction must be validly and reliably measured. Dramatic improvements made in many of these patient outcomes through the twentieth century have not been sustained through the twenty-first. Most studies have shown no, or only modest improvements in the past several years, and at a considerable increase in cost. These data suggest that the rate of healthcare improvement is slowing and that many of the quality improvements touted have not been associated with improved outcomes.

Surrogate Markers

The most common measures of quality of healthcare come from Donabedian in 1966 (1). He identified two major foci for the measuring quality of care-outcome and process. Outcome referred to the condition of the patient and the effectiveness of healthcare including traditional outcome measures such as morbidity, mortality, length of stay, readmission, etc. Process of care represented an alternative approach which examined the process of care itself rather than its outcomes.

Beginning in the 1970’s the Joint Commission began to address healthcare quality by requiring hospitals to perform medical audits. However, the Joint Commission soon realized that the audit was “tedious, costly and nonproductive” (2). Efforts to meet audit requirements were too frequently “a matter of paper compliance, with heavy emphasis on data collection and few results that can be used for follow-up activities. In the shuffle of paperwork, hospitals often lost sight of the purpose of the evaluation study and, most important, whether change or improvement occurred as a result of audit”. Furthermore, survey findings and research indicated that audits had not resulted in improved patient care and clinical performance (2).

In response to the ineffectiveness of the audit and the call to improve healthcare, the Joint Commission introduced new quality assurance standards in 1980 which emphasized measurable improvement in process of care rather than outcomes. This approach proved popular with both regulatory agencies and healthcare investigators since it was easier and quicker to show improvement in process of care surrogate markers than outcomes.

Although there are many examples of the misapplication of these surrogate markers, one recent example of note is ventilator-associated pneumonia (VAP), a diagnosis without a clear definition. VAP guidelines issued by the Institute for Healthcare Improvement include elevation of the head of the bed, daily sedation vacation, daily readiness to wean or extubate, daily spontaneous breathing trial, peptic ulcer disease prophylaxis, and deep venous thrombosis prophylaxis. As early as 2011, the evidence basis of these guidelines was questioned (3). Furthermore, compliance with the guidelines had no influence on the incidence of VAP or inpatient mortality (3). Nevertheless, relying on self-reported hospital data the CDC published data touting declines in VAP rates of 71% and 62% in medical and surgical intensive care units, respectively, between 2006 and 2012 (4,5). However, Metersky and colleagues (6) reviewed Medicare Patient Safety Monitoring System (MPSMS) data on 86,000 critically ill patients between 2005 and 2013 and report that VAP rates remain unchanged since 2005.

Hospital Value-Based Purchasing (HVBP)

CMS’ own data might be interpreted as showing no improvement in quality. About 200 fewer hospitals will see bonuses from the Centers for Medicare and Medicaid Services (CMS) under the hospital value-based purchasing (HVBP) program in 2017 than last year (7). The program affects some 3,000 hospitals and compares hospitals to other hospitals and its own performance over time.

The reduction in payments are “somewhat concerning,” according to Francois de Brantes, executive director of the Health Care Incentives Improvement Institute (7). One reason given was fewer hospitals were being rewarded, but another was hospitals' lack of movement in rankings. The HVBP contains inherent design flaws according to de Brantes. As a "tournament-style" program in which hospitals are stacked up against each other, they don't know how they'll perform until the very end of the tournament. "It's not as if you have a specific target," he said. "You could meet that target, but if everyone meets that target, you're still in the middle of the pack."

Although de Brantes point is well taken, another explanation might be that HVBP might reflect a declining performance in healthcare. If the HVBP program is to reward quality of care, fewer hospitals being rewarded logically indicates poorer care. As noted above, CMS will likely be quick to point out that they have established an ever-increasing litany of "quality" measures self-reported by the hospitals that show increasing compliance with these measures (8). However, the lack of improvement in patient outcomes (see below) suggests that completion of these has little meaningful effect.

Life Expectancy

Although life expectancy for the Medicare age group is improving, the increase likely reflects a long-term improvement in life expectancy and may be slowing over the past few years (Figure 1) (9). Since 2005, life expectancy at birth in the U.S. has increased by only 1 year (10).

Figure 1. Life expectancy past age 65 by year.

The reason(s) for the declining improvement in life expectancy in the twenty-first century compared to the dramatic improvements in the twentieth are unclear but likely multifactorial. However, one possible contributing factor to a slowing improvement in mortality is a declining or flattening rate of improvement in healthcare.

Inpatient Mortality

Figueroa et al. (11) examined the association between HVBP and patient mortality in 2,430,618 patients admitted to US hospitals from 2008 through 2013. Main outcome measures were 30-day risk adjusted mortality for acute myocardial infarction, heart failure, and pneumonia using a patient level linear spline analysis to examine the association between the introduction of the HVBP program and 30-day mortality. Non-incentivized, medical conditions were the comparators. The difference in the mortality trends between the two groups was small and non-significant (difference in difference in trends −0.03% point difference for each quarter, 95% confidence interval −0.08% to 0.13%-point difference, p=0.35). In no subgroups of hospitals was HVBP associated with better outcomes, including poor performers at baseline.

Consistent with Figueroa’s data, inpatient mortality trends declined only modestly from 2000 to 2010 (Figure 2) (12).

Figure 2. Number of inpatient deaths 2000-10.

Although the decline was significant, the significance appears to be mostly explained by a greater that expected drop in 2010 and may not represent a real ongoing decrease. Consistent with the modest improvements seen in overall inpatient mortality, disease-specific mortality rates for stroke, acute myocardial infarction (AMI), pneumonia and congestive heart failure (CHF) all declined from 2002-12. However, the trend appears to have slowed since 2007 especially for CHF and pneumonia (Figure 3).

Figure 3. Inpatient mortality rates for stroke, acute myocardial infarction (AMI), pneumonia and congestive heart failure (CHF) 2002-12.

Consistent with the trend of slowing improvement, mortality rates for these four conditions declined at −0.13% for each quarter during from 2008 until Q2 2011 but only −0.03% from Q3 2011 until the end of 2013 (12).

Patient Ratings of Healthcare

CMS has embraced the concept of patient satisfaction as a quality measure, even going so far as rating hospitals based on patient satisfaction (13). The Gallup company conducts an annual poll of Americans' ratings of their healthcare (14). In general, these have not improved and may have actually declined in the past 2 years (Figure 4).

Figure 4. Americans’ rating of their healthcare.

Cost

There is little doubt that healthcare costs have risen (15). The rising cost of healthcare has been cited as a major factor in Americans’ poor rating of their healthcare. The trend appears to be one of increasing dissatisfaction with the cost of healthcare (Figure 5) (16).

Figure 5. Americans’ satisfaction or dissatisfaction with the cost of healthcare.

Discussion

Americans have enjoyed remarkable improvements in life expectancy, mortality, and satisfaction with their healthcare over the past 100 years. However, the rate of these improvements appears to have slowed despite an ever-escalating cost. Starting with a much lower life expectancy in the US, primarily due to infections disease, the dramatic effect of antibiotics and vaccines on overall mortality in the twentieth century would be difficult to duplicate. The current primary causes of mortality in the US, heart disease and cancer, are perhaps more difficult to impact in the same way. However, declining healthcare quality may explain, at least in part, the slowing improvement in healthcare.

The evidence of lack, or only modest, improvement in patient outcomes is part of a disturbing trend in quality improvement programs by healthcare regulatory agencies. Under political pressure to “improve” healthcare, these agencies have  imposed weak or non-evidence based guidelines for many common medical disorders. In the case of CMS, hospitals are required to show compliance improvement under the threat of financial penalties. Not surprisingly, hospitals show an improvement in compliance whether achieved or not (17). The regulatory agency then extrapolates this data from previous observational studies to show a decline in mortality, cost or other outcomes. However, actual measure of the outcomes is rarely performed. This difference is important because a reduction in a surrogate marker may not be associated with improved outcomes, or worse, the improvement may be fictitious. For example, many patients often die with a hospital-acquired infection. Certainly, hospital-acquired infections are associated with increased mortality. However, preventing the infections does not necessarily prevent death. For example, in patients with widely metastatic cancer, infection is a common cause of death. However, preventing or treating the infection, may do little other than delay the inevitable. A program to improve infections in these patients would likely have little effect on any meaningful patient outcomes.

There is also a trend of bundling weakly evidence-based, non-patient centered surrogate markers with legitimate performance measures (18). Under threat of financial penalties, hospitals are required to improve these surrogate markers, and not surprisingly their reports indicate they do. The organization mandating compliance with their outcomes reports that under their guidance hospitals have significantly improved healthcare saving both lives and money. However, if the outcome is meaningless or the hospital lies about their improvement, there is no overall quality improvement. There is little incentive for the parties to question the validity of the data. The organization that mandates the program would be politically embarrassed by an ineffective program and the hospital would be financially penalized for honest reporting.

Improvement begins with the establishment of measures that are truly evidence-based. Surrogate markers should only be used when improvement in that marker has been unequivocally shown to improve patient-centered outcomes. The validity of the data also needs to be independently confirmed. Those regulatory agency-demanded quality improvement programs that do not meet these criteria need to be regarded for what they are-political propaganda rather than real solutions.

The above data suggest that healthcare is improving little in what matters most, patient-centered outcomes. Those claims by regulatory agencies of improved healthcare should be regarded with skepticism unless corroborated by improvement in valid patient-centered outcomes.

References

  1. Donabedian A. Evaluating the quality of medical care. 1966. Milbank Q. 2005;83(4):691-729. [PubMed]
  2. Affeldt JE. The new quality assurance standard of the Joint Commission on Accreditation of Hospitals. West J Med. 1980;132:166-70. [PubMed]
  3. Padrnos L, Bui T, Pattee JJ, et al. Analysis of overall level of evidence behind the Institute of Healthcare Improvement ventilator-associated pneumonia guidelines. Southwest J Pulm Crit Care 2011;3:40-8.
  4. Edwards JR, Peterson KD, Andrus ML, et al; NHSN Facilities. National Healthcare Safety Network (NHSN) Report, data summary for 2006, issued June 2007. Am J Infect Control. 2007;35(5):290-301. [CrossRef] [PubMed]
  5. Dudeck MA, Weiner LM, Allen-Bridson K, et al. National Healthcare Safety Network (NHSN) report, data summary for 2012, device-associated module. Am J Infect Control. 2013;41(12):1148-66. [CrossRef] [PubMed]
  6. Metersky ML, Wang Y, Klompas M, Eckenrode S, Bakullari A, Eldridge N. Trend in ventilator-associated pneumonia rates between 2005 and 2013. JAMA. 2016 Dec 13;316(22):2427-9. [CrossRef] [PubMed]
  7. Whitman E. Fewer hospitals earn Medicare bonuses under value-based purchasing. Medscape. November 1, 2016. Available at: http://www.modernhealthcare.com/article/20161101/NEWS/161109986 (accessed 11/3/16).
  8. Centers for Medicare & Medicaid Services. 2015 national impact assessment of the centers for medicare & medicaid services (CMS). quality measures report. March 2, 2015. Available at: https://www.cms.gov/medicare/quality-initiatives-patient-assessment-instruments/qualitymeasures/downloads/2015-national-impact-assessment-report.pdf (accessed 11/3/16).
  9. National Center for Health Statistics. Health, United States, 2015: With Special Feature on Racial and Ethnic Health Disparities. Hyattsville, MD. 2016. Available at: http://www.cdc.gov/nchs/data/hus/hus15.pdf#015 (accessed 11/3/16).
  10. Johnson NB, Hayes LD, Brown K, Hoo EC, Ethier KA. CDC National health report: leading causes of morbidity and mortality and associated behavioral risk and protective factors—United States, 2005–2013October 31, 2014/ 63(04);3-27. Available at: https://www.cdc.gov/mmwr/preview/mmwrhtml/su6304a2.htm (accessed 11/3/16).
  11. Figueroa JF, Tsugawa Y, Zheng J, Orav EJ, Jha AK. Association between the Value-Based Purchasing pay for performance program and patient mortality in US hospitals: observational study. BMJ. 2016 May 9;353:i2214.
  12. Centers for Disease Control. Trends in inpatient hospital deaths: national hospital discharge survey, 2000–2010. March 2013. Available at: http://www.cdc.gov/nchs/products/databriefs/db118.htm (accessed 11/3/16).
  13. CMS. First release of the overall hospital quality star rating on hospital compare. July 27, 2016. Available at: https://www.cms.gov/Newsroom/MediaReleaseDatabase/Fact-sheets/2016-Fact-sheets-items/2016-07-27.html (accessed 11/3/16)
  14. Newport F. Ratings of U.S. healthcare quality no better after ACA. November 19, 2015. Available at: http://www.gallup.com/poll/186740/americans-own-healthcare-ratings-little-changed-aca.aspx (accessed 11/3/16).
  15. Robbins RA. National health expenditures: the past, present, future and solutions. Southwest J Pulm Crit Care. 2015;11(4):176-85.
  16. Newport F. Ratings of U.S. healthcare quality no better after ACA. November 19, 2015. Available at: http://www.gallup.com/poll/186740/americans-own-healthcare-ratings-little-changed-aca.aspx (accessed 11/3/16).
  17. Meddings JA, Reichert H, Rogers MA, Saint S, Stephansky J, McMahon LF. Effect of nonpayment for hospital-acquired, catheter-associated urinary tract infection: a statewide analysis. Ann Intern Med 2012;157:305-12. [CrossRef] [PubMed]
  18. CMS. Bundled payments for care improvement (BPCI) initiative: general information. November 28, 2016. Available at:  https://innovation.cms.gov/initiatives/bundled-payments/ (accessed 12/30/16).

Cite as: Robbins RA. Is quality of healthcare improving in the US? Southwest J Pulm Crit Care. 2017;14(1):29-36. doi: https://doi.org/10.13175/swjpcc110-16 PDF 

Monday
Sep232013

A Comparison Between Hospital Rankings and Outcomes Data

Richard A. Robbins, MD*

Richard D. Gerkin, MD  


*Phoenix Pulmonary and Critical Care Research and Education Foundation, Gilbert, AZ

Banner Good Samaritan Medical Center, Phoenix, AZ


Abstract

Hospital rankings have become common but the agreement between the rankings and correlation with patient-centered outcomes remains unknown. We examined the ratings of Joint Commission on Healthcare Organizations (JCAHO), Leapfrog, and US News and World Report (USNews), and outcomes from Centers for Medicare and Medicaid Hospital Compare (CMS) for agreement and correlation. There was some correlation among the three “best hospitals” ratings.  There was also some correlation between “best hospitals” and CMS outcomes, but often in a negative direction.  These data suggest that no one “best hospital” list identifies hospitals that consistently attain better outcomes.

Introduction

Hospital rankings are being published by a variety of organizations. These rankings are used by hospitals to market the quality of their services. Although all the rankings hope to identify “best” hospitals, they differ in methodology. Some emphasize surrogate markers; some emphasize safety, i.e., a lack of complications; some factor in the hospital’s reputation; some factor in patient-centered outcomes.  However, most do not emphasize traditional outcome measures such as mortality, mortality, length of stay and readmission rates. None factor cost or expenditures on patient care.

We examined three common hospital rankings and clinical outcomes. We reasoned that if the rankings are valid then better hospitals should be consistently on these best hospital lists. In addition, better hospitals should have better outcomes.

Methods

CMS

Outcomes data was obtained from the CMS Hospital Compare website from December 2012-January 2013 (1). The CMS website presents data on three diseases, myocardial infarction (MI), congestive heart failure (CHF) and pneumonia. We examined readmissions, complications and deaths for each of these diseases. We did not examine all process of care measures since many of the measures have not been shown to correlate with improved outcomes and patient satisfaction has been shown to correlate with higher admission rates to the hospital, higher overall health care expenditures, and increased mortality (2). In some instances actual data is not presented on the CMS website but only higher, lower or no different from the National average. In this case, scoring was done 2, 0 and 1 respectively with 2=higher, 0=lower and 1=no different.

Mortality is the 30-day estimates of deaths from any cause within 30 days of a hospital admission, for patients hospitalized with one of several primary diagnoses (MI, CHF, and pneumonia). Mortality was reported regardless of whether the patient died while still in the hospital or after discharge. Similarly, the readmission rates are 30-day estimates of readmission for any cause to any acute care hospital within 30 days of discharge. The mortality and readmission measures rates were adjusted for patient characteristics including the patient’s age, gender, past medical history, and other diseases or conditions (comorbidities) the patient had at hospital arrival that are known to increase the patient’s risk of dying or readmission.

The rates of a number of complications are also listed in the CMS data base (Table 1).

Table 1. Complications examined that are listed in CMS data base.

CMS calculates the rate for each serious complication by dividing the actual number of outcomes at each hospital by the number of eligible discharges for that measure at each hospital, multiplied by 1,000. The composite value reported on Hospital Compare is the weighted averages of the component indicators.  The measures of serious complications reported are risk adjusted to account for differences in hospital patients’ characteristics. In addition, the rates reported on Hospital Compare are “smoothed” to reflect the fact that measures for small hospitals are measured less accurately (i.e., are less reliable) than for larger hospitals.

Similar to serious infections, CMS calculates the hospital acquired infection data from the claims hospitals submitted to Medicare. The rate for each hospital acquired infection measure is calculated by dividing the number of infections that occur within any given eligible hospital by the number of eligible Medicare discharges, multiplied by 1,000. The hospital acquired infection rates were not risk adjusted.

JCAHO

The JCAHO list of Top Performers on Key Quality Measures™ was obtained from its 2012 list (3). The Top Performers are based on an aggregation of accountability measure data reported to The JCAHO during the previous calendar year.

Leapfrog

Leapfrog’s Hospital Safety Score were obtained from their website during December 2012-January 2013 (4). The score utilizes 26 National performance measures from the Leapfrog Hospital Survey, the Agency for Healthcare Research and Quality (AHRQ), the Centers for Disease Control and Prevention (CDC), and the Centers for Medicare and Medicaid Services (CMS) to produce a single composite score that represents a hospital’s overall performance in keeping patients safe from preventable harm and medical errors. The measure set is divided into two domains: (1) Process/Structural Measures and (2) Outcome Measures. Many of the outcome measures are derived from the complications reported by CMS (Table 1). Each domain represents 50% of the Hospital Safety Score. The numerical safety score is then converted into one of five letter grades. "A" denotes the best hospital safety performance, followed in order by "B", "C", “D,” and “F.” For analysis, these letter grades were converted into numerical grades 1-5 corresponding to letter grades A-F.

US News and World Report

US News and World Report’s (USNews) 2012-3 listed 17 hospitals on their honor roll (5). The rankings are based largely on objective measures of hospital performance, such as patient survival rates, and structural resources, such as nurse staffing levels. Each hospital’s reputation, as determined by a survey of physician specialists, was also factored in the ranking methodology. The USNews top 50 cardiology and pulmonology hospitals were also examined.

Statistical Analysis

Categorical variables such as JCAHO and USNews best hospitals were compared with other data using chi-squared analysis. Spearman rank correlation was used to help determine the direction of the correlations (positive or negative). Significance was defined as p<0.05.

Results

Comparisons of Hospital Rankings between Organizations

A large database of nearly 3000 hospitals was compiled for each of the hospital ratings (Appendix 1). The “best hospitals” as rated by the JCAHO, Leapfrog and USNews were compared for correlation between the organizations (Table 2).

Table 2. Correlation of “best hospitals” between different organizations

There was significant correlation between the JCAHO and Leapfrog and Leapfrog and USNews but not between JCAHO and USNews.

JCAHO-Leapfrog Comparison

The Leapfrog grades were significantly better for JCAHO “Best Hospitals” compared to hospitals not listed as “Best Hospitals” (2.26 + 0.95  vs. 1.85 + 0.91, p<0.0001). However, there were multiple exceptions. For example, of the 358 JCAHO “Best Hospitals” with a Leapfrog grade, 84 were graded “C”, 11 were graded “D” and one was graded as “F”.

JCAHO-USNews Comparison

Of the JCAHO “Top Hospitals” only one was listed on the USNews “Honor Roll”. Of the cardiology and pulmonary “Top 50” hospitals only one and two hospitals, respectively, were listed on the JCAHO “Top Hospitals” list.

Leapfrog-USNews Comparison

The Leapfrog grades of the US News “Honor Roll” hospitals did not significantly differ compared to the those hospitals not listed on the “Honor Roll” (2.21 + 0.02 vs. 1.81 + 0.31, p>0.05). However, Leapfrog grades of the US News “Top 50 Cardiology” hospitals had better Leapfrog grades (2.21 +  0.02 vs. 1.92 + 0.14, p<0.05). Similarly, Leapfrog grades of the US News “Top 50 Pulmonary” hospitals had better Leapfrog grades (2.21 + 0.02 vs. 1.91 + 0.15, p<0.05).

“Best Hospital” Mortality, Readmission and Serious Complications

The data for the comparison between the hospital rankings and CMS’ readmission rates, mortality rates and serious complications for the JCAHO, Leapfrog, and USNews are shown in Appendix 2, Appendix 3, and Appendix 4 respectively. The results of the comparison of “best hospitals” compared to hospitals not listed as best hospitals are shown in Table 3.

Table 3. Results of “best hospitals” compared to other hospitals for mortality and readmission rates for myocardial infarction (MI), congestive heart failure (CHF) and pneumonia.

Red:  Relationship is concordant (better rankings associated with better outcomes)

Blue:  Relationship is discordant (better rankings associated with worse outcomes)

Note that of 21 total p values for relationships, 12 are non-significant, 6 are concordant and significant, and 6 are discordant and significant.  All 4 of the significant readmission relationships are discordant. All 5 of the significant mortality relationships are concordant. This underscores the disjunction of mortality and readmission. All 3 of the relationships with serious complications are significant, but one of these is discordant. Of the 3 ranking systems, Leapfrog has the least correlation with CMS outcomes (5/7 non-significant).  USNews has the best correlation with CMS outcomes (6/7 significant).  However, 3 of these 6 are discordant.

The USNews “Top 50” hospitals for cardiology and pulmonology were also compared to those hospitals not listed as “Top 50” hospitals for cardiology and pulmonology. Similar to the “Honor Roll” hospitals there was a significantly higher proportion of hospitals with better mortality rates for MI and CHF for the cardiology “Top 50” and for pneumonia for the pulmonary “Top 50”. Both the cardiology and pulmonary “Top 50” had better serious complication rates (p<0.05, both comparisons, data not shown).

Discussion

Lists of hospital rankings have become widespread but whether these rankings identify better hospitals is unclear. We reasoned that if the rankings were meaningful then there should be widespread agreement between the hospital lists. We did find a level of agreement but there were exceptions. Hospital rankings should correlate with patient-centered outcomes such as mortality and readmission rates. Overall that level of agreement was low.

One probable cause accounting for the differences in hospital rankings is the differing methodologies used in determined the rankings. For example, JCAHO uses an aggregation of accountability measures. Leapfrog emphasizes safety or a lack of complications. US News uses patient survival rates, structural resources, such as nurse staffing levels, and the hospital’s reputation. However, the exact methodolgical data used to formulate the rankings is often vague, especially for JCAHO and US News rankings. Therefore, it should not be surprising that the hospital rankings differ.

Another probable cause for the differing rankings is the use of selected complications in place of patient-centered outcome measures. Complications are most meaningful when they negatively affect ultimate patient outcomes. Some complications such as objects accidentally left in the body after surgery, air bubble in the bloodstream or mismatched blood types are undesirable but very infrequent. Whether a slight, but significant, increase in these complications would increase more global measures such as morality or readmission rates is unlikely. The overall poor correlation of these outcomes with deaths and readmissions in the CMS database is consistent with this concept.

Some of the surrogate complication rates are clearly evidence-based but some are clearly not. For example, many of the central-line associated infection and ventilator-associated pneumonia guidelines used are non-evidence based (6.7). Furthermore, overreaction to correct some of the complications such as “signs of uncontrolled blood sugar” may be potentially harmful. This complication could be interpreted as tight control of the blood sugar. Unfortunately, when rigorously studied, patients with tight glucose control actually had an increase in mortality (8).

In some instances a complication was associated with improved outcomes. Although the reason for this discordant correlation is unknown, it is possible that the complication may occur as a result of better care. For example, catherization of a central vein for rapid administration of fluids, drugs, blood products, etc. may result in better outcomes or quality but will increase the central line-associated bloodstream infection rate. In contrast, not inserting a catheter when appropriate might lead to worse outcomes or poorer quality but would improve the infection rate.

Many of the rankings are based, at least in part, on complication data self-reported by the hospitals to CMS. However, the accuracy of this data has been called into question (9,10). Meddings et al. (10) studied urinary tract infections which were self-reported by hospitals using claims data. According to Meddings (10), the data were “inaccurate” and not were “not valid data sets for comparing hospital acquired catheter-associated urinary tract infection rates for the purpose of public reporting or imposing financial incentives or penalties”. The authors proposed that the nonpayment by Medicare for “reasonably preventable” hospital-acquired complications resulted in this discrepancy. Inaccurate data may lead to the lack of correlation a complication and outcomes on the CMS database.

The sole source of mortality and readmission data in this study was CMS. This is limited to Medicare and Medicaid patients but is probably representative of the general population in an acute care hospital. However, also included on the CMS website is a dizzying array of measures. We did not analyze every measure but analyzed only those listed in Table 1. Whether examination of other measures would correlate with mortality and readmission rates is unclear.

There are several limitations to our data. First and foremost, the CMS data is self-reported by hospitals. The validity and accuracy of the data has been called into question. Second, data is missing in multiple instances. For example, much of the data from Maryland was not present. Also, there were multiple instances when the data was “unavailable” or the “number of cases are too small”.  Third, in some instances CMS did not report actual data but only higher, lower or no different from the National average. This loss of information may have led to inaccurate analyses. Fourth, much of the data are from surrogate markers, a fact which is important since surrogate markers have not been shown to predict outcomes. This is also puzzling since patient-centered outcomes are available.  Fifth, much of the outcomes data is derived from CMS which to a large extent eliminates Veterans Administration, pediatric, mental health and some other specialty facilities.

It is unclear if any of the hospital rankings should be used by patients or healthcare providers when choosing a hospital. At present it would appear that the rankings have an over reliance on surrogate markers, many of which are weakly evidence-based. Furthermore, categorizing the data as average, below or above average may lead to an inaccurate interpretation of the data. Lastly, the accuracy of the data is unclear. Finally, lack of data on length of stay and some major morbidities is a major weakness. We as physicians need to scrutinize these measurement systems and insist on greater methodological rigor and more relevant criteria to choose. Until these shortcomings are overcome, we cannot recommend the use of hospital rankings by patients or providers.

References

  1. http://www.medicare.gov/hospitalcompare/ (accessed 6/12/13).
  2. Fenton JJ, Jerant AF, Bertakis KD, Franks P. The cost of satisfaction: a national study of patient satisfaction, health care utilization, expenditures, and mortality. Arch Intern Med. 2012;172(5):405-11. [CrossRef] [PubMed]
  3. http://www.jointcommission.org/annualreport.aspx (accessed 6/12/13).
  4. http://www.hospitalsafetyscore.org (accessed 6/12/13).
  5. http://health.usnews.com/best-hospitals (accessed 6/12/13).
  6. Padrnos L, Bui T, Pattee JJ, Whitmore EJ, Iqbal M, Lee S, Singarajah CU, Robbins RA. Analysis of overall level of evidence behind the Institute of Healthcare Improvement ventilator-associated pneumonia guidelines. Southwest J Pulm Crit Care. 2011;3:40-8.
  7. Hurley J, Garciaorr R, Luedy H, Jivcu C, Wissa E, Jewell J, Whiting T, Gerkin R, Singarajah CU, Robbins RA. Correlation of compliance with central line associated blood stream infection guidelines and outcomes: a review of the evidence. Southwest J Pulm Crit Care. 2012;4:163-73.
  8. NICE-SUGAR Study Investigators. Intensive versus conventional insulin therapy in critically ill patients. N Engl J Med. 2009;360:1283-97. [CrossRef] [Pubmed]
  9. Robbins RA. The emperor has no clothes: the accuracy of hospital performance data. Southwest J Pulm Crit Care. 2012;5:203-5.
  10. Meddings JA, Reichert H, Rogers MA, Saint S, Stephansky J, McMahon LF. Effect of nonpayment for hospital-acquired, catheter-associated urinary tract infection: a statewide analysis. Ann Intern Med. 2012;157:305-12. [CrossRef] [PubMed]

Reference as: Robbins RA, Gerkin RD. A comparison between hospital rankings and outcomes data. Southwest J Pulm Crit Care. 2013;7(3):196-203. doi: http://dx.doi.org/10.13175/swjpcc076-13 PDF

Thursday
Jun132013

Comparisons between Medicare Mortality, Readmission and Complications

Richard A. Robbins, MD*

Richard D. Gerkin, MD  


*Phoenix Pulmonary and Critical Care Research and Education Foundation, Gilbert, AZ

Banner Good Samaritan Medical Center, Phoenix, AZ


Abstract

The Center for Medicare and Medicaid Services (CMS) has been a leading advocate of evidence-based medicine. Recently, CMS has begun adjusting payments to hospitals based on hospital readmission rates and “value-based performance” (VBP). Examination of the association of Medicare bonuses and penalties with mortality rates revealed that the hospitals with better mortality rates for heart attacks, heart failure and pneumonia had significantly greater penalties for readmission rates (p<0.0001, all comparisons). A number of specific complications listed in the CMS database were also examined for their correlations with mortality, readmission rates and Medicare bonuses and penalties. These results were inconsistent and suggest that CMS continues to rely on surrogate markers that have little or no correlation with patient-centered outcomes.

Introduction

Implementation of the Affordable Care Act (ACA) emphasized the use of evidence-based measures of care (1). However, the scientific basis for many of these performance measures and their correlation with patient-centered outcomes such as mortality, morbidity, length of stay and readmission rates have been questioned (2-6). Recently, CMS has begun adjusting payments based on readmission rates and “value-based performance” (VBP) (7). Readmission rates and complications are based on claims submitted by hospitals to Medicare (8).

We sought to examine the correlations between mortality, hospital readmission rates, complications and adjustments in Medicare reimbursement. If the system of determining Medicare reimbursements is based on achievement of better patient outcomes, then one hypothesis is that lower readmission rates would be associated with lower mortality.  An additional hypothesis is that complications would be inversely associated with both mortality and readmission rates. 

Methods

Hospital Compare

Data was obtained from the CMS Hospital Compare website from December 2012-January 2013 (8). The data reflects composite data of all hospitals that have submitted claims to CMS. Although a number of measures are listed, we recorded only readmissions, complications and deaths since many of the process of care measures have not been shown to correlate with improved outcomes. Patient satisfaction was not examined since higher patient satisfaction has been shown to correlate with higher admission rates to the hospital, higher overall health care expenditures, and increased mortality (9). In some instances data are presented in Hospital Compare as higher, lower or no different from the National average. In this case, scoring was done 2, 0 and 1 respectively with 0=higher, 2=lower and 1=no different.

Mortality

Mortality was obtained from Hospital Compare and is the 30-day estimates of deaths from any cause within 30 days of a hospital admission for patients hospitalized for heart attack, heart failure, or pneumonia regardless of whether the patient died while still in the hospital or after discharge. The mortality and rates are adjusted for patient characteristics including the patient’s age, gender, past medical history, and other diseases or conditions (comorbidities) the patient had at hospital arrival that are known to increase the patient’s risk of dying.

Readmission Rates

Similarly, the readmission rates are 30-day estimates of readmission for any cause to any acute care hospital within 30 days of discharge. These measures include patients who were initially hospitalized for heart attack, heart failure, and pneumonia. Similar to mortality, the readmission measures rates are adjusted for patient characteristics including the patient’s age, gender, past medical history, and other diseases or conditions (comorbidities) the patient had at hospital arrival that are known to increase the patient’s risk for readmission.

Complications

CMS calculates the rate for each complication by dividing the actual number of self-reported outcomes at each hospital by the number of eligible discharges for that measure at each hospital, multiplied by 1,000. The composite value reported on Hospital Compare is the weighted averages of the component indicators.  The measures of serious complications reported are risk adjusted to account for differences in hospital patients’ characteristics. In addition, the rates reported on Hospital Compare are “smoothed” to reflect the fact that measures for small hospitals are measured less accurately (i.e., are less reliable) than for larger hospitals.

CMS calculates the hospital acquired infection data from the claims hospitals submit to Medicare. The rate for each hospital acquired infection measure is calculated by dividing the number of infections that occur within any given eligible hospital by the number of eligible Medicare discharges, multiplied by 1,000. The hospital acquired infection rates were not risk adjusted by CMS.

In addition to the composite data, individual complications listed in the CMS database were examined (Table 1).

Table 1. Complications examined that are listed in CMS data base.

Objects Accidentally Left in the Body After Surgery

Air Bubble in the Bloodstream

Mismatched Blood Types

Severe Pressure Sores (Bed Sores)

Falls and Injuries

Blood Infection from a Catheter in a Large Vein

Infection from a Urinary Catheter

Signs of Uncontrolled Blood Sugar


Medicare Bonuses and Penalties

The CMS data was obtained from Kaiser Health News which had compiled the data into an Excel database (10).


Statistical Analysis

Data was reported as mean + standard error of mean (SEM). Outcomes between hospitals rated as better were compared to those of hospitals rated as average or worse using Student’s t-test. The relationship between continuous variables was obtained using the Pearson correlation coefficient. Significance was defined as p<0.05. All p values reported are nominal, with no correction for multiple comparisons.

Results

A large database was compiled for the CMS outcomes and each of the hospital ratings (Appendix 1). There were over 2500 hospitals listed in the database.

Mortality and Readmission Rates

A positive correlation for heart attack, heart failure and pneumonia was found between hospitals with better mortality rates (p<0.001 all comparisons). In other words, hospitals with better mortality rates for heart attack tended to be better mortality performers for heart failure and pneumonia, etc.  Surprisingly, the hospitals with better mortality rates for heart attack, heart failure and pneumonia had higher readmission rates for these diseases (p<0.001, all comparisons).

Examination of the association of Medicare bonuses and penalties with mortality rates revealed that the hospitals with better mortality rates for heart attacks, heart failure and pneumonia received the same compensation for value-based performance as hospitals with average or worse mortality rates (Appendix 2, p>0.05, all comparisons). However, these better hospitals had significantly larger penalties for readmission rates (Figure 1, p<0.0001, all comparisons). 


Figure 1.  Medicare bonuses and penalties for readmission rates of hospitals with better, average or worse mortality for myocardial infarction (heart attack, Panel A), heart failure (Panel B), and pneumonia (Panel C).

Because total Medicare penalties are the average of the adjustment for VBP and readmission rates, the reduction in reimbursement was reflected with higher total penalty rates for hospitals with better mortality rates for heart attacks, heart failure and pneumonia (Figure 2 , p<0.001, all comparisons).

Figure 2.  Total Medicare bonuses and penalties for readmission rates of hospitals with better, average or worse mortality for myocardial infarction (heart attack, Panel A), heart failure (Panel B), and pneumonia (Panel C).

Mortality Rates and Complications

The rates of a number of complications are also listed in the CMS database (Table 1). A correlation was performed for each complication compared to the hospitals with better, average or worse death and readmission rates for heart attacks, heart failure and pneumonia (Appendix 3). A positive correlation of hospitals with better mortality rates was only observed for falls and injuries in the hospitals with better death rates from heart failure (p<0.02). However, severe pressure sores also differed in the hospitals with better mortality rates for heart attack and heart failure, but this was a negative correlation (p<0.05 both comparisons). In other words, hospitals that performed better in mortality performed worse in severe pressure sores. Similarly, hospitals with better mortality rates for heart failure had higher rates of blood infection from a catheter in a large vein compared to hospitals with an average mortality rate (p<0.001). None of the remaining complications differed.

Readmission Rates and Complications

A correlation was also performed between complications and hospitals with better, average and worse readmission rates for myocardial infarction, heart failure, and pneumonia (Appendix 4). Infections from a urinary catheter and falls and injuries were more frequent in hospitals with better readmission rates for myocardial infarction, heart failure, and pneumonia compared to hospitals with the worse readmission rates (p<0.02, all comparisons). Hospitals with better readmission rates for heart failure also had higher infections from a urinary catheter compared to hospitals with average readmission rates for heart failure (p<0.001). None of the remaining complications significantly differed 

Discussion

The use of “value-based performance” (VBP) has been touted as having the potential for improving care, reducing complications and saving money. However, we identified a negative correlation between deaths and readmissions, i.e., those hospitals with the better mortality rates were receiving larger financial penalties for readmissions and total compensation. Furthermore, correlations of hospitals with better mortality and readmission rates with complications were inconsistent.

Our data compliments and extends the observations of Krumholz et al. (11). These investigators examined the CMS database from 2005-8 for the correlation between mortality and readmissions. They identified an inverse correlation between mortality and readmission rates with heart failure but not heart attacks or pneumonia. However, with the financial penalties now in place for readmissions, it now seems likely hospital practices may have changed.

CMS compensating hospitals for lower readmission rates is disturbing since higher readmission rates correlated with better mortality. This equates to rewarding hospitals for practices leading to lower readmission rates but increase mortality. The lack of correlation for the other half of the payment adjustment, so called “value-based purchasing” is equally disturbing since if apparently has little correlation with patient outcomes.

Although there is an inverse correlation between mortality and readmissions, this does not prove cause and effect. The causes of the inverse association between readmissions and mortality rates are unclear, but the most obvious would be that readmissions may benefit patient survival. The reason for the lack of correlation between mortality and readmission rates with most complication rates is also unclear. VBP appears to rely heavily on complications that are generally infrequent and in some cases may be inconsequential. Furthermore, many of the complications are for all intents and purposes self-reported by the hospitals to CMS since they are based on claims data. However, the accuracy of these data has been called into question (12,13). Meddings et al. (13) studied urinary tract infections. According to Meddings, the data were “inaccurate” and not were “not valid data sets for comparing hospital acquired catheter-associated urinary tract infection rates for the purpose of public reporting or imposing financial incentives or penalties”. The authors proposed that the nonpayment by Medicare for “reasonably preventable” hospital-acquired complications resulted in this discrepancy. Inaccurate data may lead to the lack of correlation a complication and outcomes on the CMS database.

According to the CMS website the complications were chosen by “wide agreement from CMS, the hospital industry and public sector stakeholders such as The Joint Commission (TJC) , the National Quality Forum (NQF), and the Agency for Healthcare Research and Quality (AHRQ) , and hospital industry leaders” (7). However, some complications such as air bubble in the bloodstream or mismatched blood types are quite rare. Others such as signs of uncontrolled blood sugar are not evidence-based (14). Other complications actually correlated with improved mortality or readmission rates. It seems likely that some of the complications might represent more aggressive treatment or could reflect increased clinical care staffing which has previously been associated with better survival (14,15). 

There are several limitations to our data. First and foremost, the data are derived from CMS Hospital Compare where the data has been self-reported by hospitals. The validity and accuracy of the data has been called into question (12,13). Second, data are missing in multiple instances. For example, data from Maryland were not present. There were multiple instances when the data were “unavailable” or the “number of cases are too small”. Third, in some instances CMS did not report actual data but only higher, lower or no different from the National average. Fourth, much of the data are from surrogate markers, a fact which is puzzling when patient-centered outcomes are available. In addition, some of these surrogate markers have not been shown to correlate with outcomes.

It is unclear if CMS Hospital Compare should be used by patients or healthcare providers when choosing a hospital. At present it would appear that the dizzying array of data reported overrelies on surrogate markers which are possibly inaccurate. Lack of adequate outcomes data and even obfuscating the data by reporting the data as average, below or above average does little to help shareholders interpret the data. The failure to apparently incorporate mortality rates as a component of VBP is another major limitation. The accuracy of the data is also unclear. Until these shortcomings can be improved, we cannot recommend the use of Hospital Compare by patients or providers.

References

  1. Obama B. Securing the future of American health care. N Engl J Med. 2012; 367:1377-81.
  2. Showalter JW, Rafferty CM, Swallow NA, Dasilva KO, Chuang CH. Effect of standardized electronic discharge instructions on post-discharge hospital utilization. J Gen Intern Med. 2011;26(7):718-23.
  3. Heidenreich PA, Hernandez AF, Yancy CW, Liang L, Peterson ED, Fonarow GC. Get With The Guidelines program participation, process of care, and outcome for Medicare patients hospitalized with heart failure. Circ Cardiovasc Qual Outcomes. 2012 ;5(1):37-43.
  4. Hurley J, Garciaorr R, Luedy H, Jivcu C, Wissa E, Jewell J, Whiting T, Gerkin R, Singarajah CU, Robbins RA. Correlation of compliance with central line associated blood stream infection guidelines and outcomes: a review of the evidence. Southwest J Pulm Crit Care. 2012;4:163-73.
  5. Robbins RA, Gerkin R, Singarajah CU. Relationship between the Veterans Healthcare Administration Hospital Performance Measures and Outcomes. Southwest J Pulm Crit Care 2011;3:92-133.
  6. Padrnos L, Bui T, Pattee JJ, Whitmore EJ, Iqbal M, Lee S, Singarajah CU, Robbins RA. Analysis of overall level of evidence behind the Institute of Healthcare Improvement ventilator-associated pneumonia guidelines. Southwest J Pulm Crit Care. 2011;3:40-8.
  7. http://www.medicare.gov/HospitalCompare/Data/linking-quality-to-payment.aspx (accessed 4/8/13).
  8. http://www.medicare.gov/hospitalcompare/ (accessed 4/8/13).
  9. Fenton JJ, Jerant AF, Bertakis KD, Franks P. The cost of satisfaction: a national study of patient satisfaction, health care utilization, expenditures, and mortality. Arch Intern Med. 2012;172:405-11.
  10. http://capsules.kaiserhealthnews.org/wp-content/uploads/2012/12/Value-Based-Purchasing-And-Readmissions-KHN.csv (accessed 4/8/13).
  11. Krumholz HM, Lin Z, Keenan PS, Chen J, Ross JS, Drye EE, Bernheim SM, Wang Y, Bradley EH, Han LF, Normand SL. Relationship between hospital readmission and mortality rates for patients hospitalized with acute myocardial infarction, heart failure, or pneumonia. JAMA. 2013;309(6):587-93. doi: 10.1001/jama.2013.333.
  12. Robbins RA. The emperor has no clothes: the accuracy of hospital performance data. Southwest J Pulm Crit Care. 2012;5:203-5.
  13. Meddings JA, Reichert H, Rogers MA, Saint S, Stephansky J, McMahon LF. Effect of nonpayment for hospital-acquired, catheter-associated urinary tract infection: a statewide analysis. Ann Intern Med. 2012;157:305-12.
  14. NICE-SUGAR Study Investigators. Intensive versus conventional insulin therapy in critically ill patients. N Engl J Med. 2009;360:1283-97.
  15. Robbins RA, Gerkin R, Singarajah CU. Correlation between patient outcomes and clinical costs in the va healthcare system. Southwest J Pulm Crit Care. 2012;4:94-100.

Reference as: Robbins RA, Gerkin RD. Comparisons between Medicare mortality, morbidity, readmission and complications. Southwest J Pulm Crit Care. 2013;6(6):278-86. PDF

Friday
Apr062012

Correlation between Patient Outcomes and Clinical Costs in the VA Healthcare System

Richard A. Robbins, M.D.1

Richard Gerkin, M.D.2

Clement U. Singarajah, M.D.1

1Phoenix Pulmonary and Critical Care Medicine Research and Education Foundation and 2Banner Good Samaritan Medical Center, Phoenix, AZ


Abstract

Introduction: Increased nursing staffing levels have previously been associated with improved patient outcomes.  However, the effects of physician staffing and other clinical care costs on clinical outcomes are unknown.

Methods: Databases from the Department of Veterans Affairs were searched for clinical outcome data including 30-day standardized mortality rate (SMR), observed minus expected length of stay (OMELOS) and readmission rate. These were correlated with costs including total, drug, lab, radiology, physician (MD), and registered nurse (RN), other clinical personnel costs and non-direct care costs.

Results: Relevant data were obtained from 105 medical centers. Higher total costs correlated with lower intensive care unit (ICU) SMR (r=-0.2779, p<0.05) but not acute care (hospital) SMR. Higher costs for lab, radiology, MD and other direct care staff costs and total direct care costs correlated with lower ICU and acute care SMR (p<0.05, all comparisons). Higher RN costs correlated only with ICU SMR. None of the clinical care costs correlated with ICU or acute care OMELOS with the exception of higher MD costs correlating with longer OMELOS. Higher clinical costs correlated with higher readmission rates (p<0.05, all comparisons). Nonclinical care costs (total costs minus direct clinical care costs) did not correlate with any outcome.

Conclusions: Monies spent on clinical care generally improve SMR. Monies spent on nonclinical care generally do not correlate with outcomes.

Introduction

Previous studies have demonstrated that decreased nurse staffing adversely affects patient outcomes including mortality in some studies (1-5). However, these studies have been criticized because studies are typically cross-sectional in design and do not account for differences in patients’ requirements for nursing care. Other observers have asked whether differences in mortality are linked not to nursing but to unmeasured variables correlated with nurse staffing (6-9). In this context, we correlate mortality with costs associated with other clinical expenditures including drug, lab, radiology, physician (MD), and other clinical personnel costs.

The observed minus the expected length of stay (OMELOS) and readmission rates are two outcome measures that are thought to measure quality of care. It is often assumed that increased OMELOS or readmission rates are associated with increased expenditures (10,11). However, data demonstrating this association are scant. Therefore, we also examined clinical care costs with OMELOS and readmission rates.

Methods

The study was approved by the Western IRB.  

Hospital level of care. For descriptive purposes, hospitals were grouped into levels of care. These are classified into 4 levels: highly complex (level 1); complex (level 2); moderate (level 3), and basic (level 4). In general, level 1 facilities and some level 2 facilities represent large urban, academic teaching medical centers.

Clinical outcomes. SMR and OMELOS were obtained from the Inpatient Evaluation Center (IPEC) for fiscal year 2009 (12). Because this is a restricted website, the data for publication were obtained by a Freedom of Information Act (FOIA) request. SMR was calculated as the observed number of patients admitted to an acute care ward or ICU who died within 30 days divided by the number of predicted deaths for the acute care ward or ICU. Admissions to a VA nursing home, rehabilitation or psychiatry ward were excluded. Observed minus expected length of stay (OMELOS) was determined by subtracting the observed length of stay minus the predicted length of stay for the acute care ward or ICU from the risk adjusted length of stay model (12). Readmission rate was expressed as a percentage of patients readmitted within 30 days.

Financial data. Financial data were obtained from the VSSC menu formerly known as the klf menu.  Because this is also a restricted website, the data for publication were also obtained by a Freedom of Information Act (FOIA) request. In each case, data were expressed as costs per unique in order to compare expenditures between groups. MD and RN costs reported on the VSSC menu were not expressed per unique but only per full time equivalent employee (FTE). To convert to MD or RN cost per unique, the costs per FTE were converted to MD or RN cost per unique as below (MD illustrated):

Similarly, all other direct care personnel costs/unique was calculated as below:

Direct care costs were calculated as the sum of drug, lab, x-ray, MD, RN, and other direct care personnel costs. Non-direct care costs were calculated as total costs minus direct care costs.

Correlation of Outcomes with Costs. Pearson correlation coefficient was used to determine the relationship between outcomes and costs. Significance was defined as p<0.05.

Results

Costs: The average cost per unique was $6058. Direct care costs accounted for 53% of the costs while non-direct costs accounted for 47% of the costs (Table 1 and Appendix 1).

Table 1. Average and percent of total costs/unique.

Hospital level. Data were available from 105 VA medical centers with acute care wards and 98 with ICUs. Consistent with previous data showing improved outcomes with larger medical centers, hospitals with higher levels of care (i.e. hospitals with lower level numbers) had decreased ICU SMR (Table 2). Higher levels of care also correlated with decreased ICU OMELOS and readmission rates (Table 2). For full data and other correlations see Appendix 1.

Table 2. Hospital level of care compared to outcomes. Lower hospital level numbers represent hospitals with higher levels of care.


*p<0.05

SMR. Increased total costs correlated with decreased intensive care unit (ICU) SMR (Table 3, r=-0.2779, p<0.05) but not acute care (hospital) SMR. Increased costs for lab, radiology, MD and other direct care staff costs and total direct care costs also correlated with decreased SMR for both ICU and acute care SMR (p<0.05, all comparisons). However, drug costs did not correlate with either acute care or ICU SMR. Increased RN costs correlated with improved ICU SMR but not acute care SMR. For full data and other correlations see Appendix 1.

Table 3. Correlation of SMR and costs.

*p<0.05

OMELOS. There was no correlation between SMR and OMELOS for either acute care (r= -0.0670) or ICU (r= -0.1553). There was no correlation between acute care or ICU OMELOS and clinical expenditures other than higher MD costs positively correlated with increased OMELOS (Table 4, p<0.05, both comparisons).

Table 4. Correlation of OMELOS and costs

*p<0.05

Readmission rate. There was no correlation between readmission rates and acute care SMR (r= -0.0074) or ICU SMR (r= 0.0463).Total and all clinical care costs directly correlated with readmission rates while non-direct clinical care costs did not (Table 5).

Table 5.Correlation of readmission rates and costs.

*p<0.05

Discussion

The data in this manuscript demonstrate that most clinical costs are correlated with a decreased or improved SMR Only MD costs correlate with OMELOS but all clinical costs directly correlate with increased readmission rates. However, non-direct care costs do not correlate with any clinical outcome.

A number of studies have examined nurse staffing.  Increased nurse staffing levels are associated with improved outcomes, including mortality in some studies (1-5). The data in the present manuscript confirm those observations in the ICU but not for acute care (hospital). However, these data also demonstrate that higher lab, X-ray and MD costs also correlate with improved SMR. Interestingly, the strongest correlation with both acute care and ICU mortality was MD costs. We speculate that these observations are potentially explained that with rare exception, nearly all physicians see patients in the VA system. The same is not true for nurses. A number of nurses are employed in non-patient care roles such as administration, billing, quality assurance, etc. It is unclear to what extent nurses without patient care responsibilities were included in the RN costs.

These data support that readmission rates are associated with higher costs but do not support that increased OMELOS is associated with higher costs implying that efforts to decrease OMELOS may be largely wasted since they do not correlate with costs or mortality. It is unclear whether the increased costs with readmissions are because readmissions lead to higher costs or the higher clinical care costs cause the higher readmissions, although the former seem more likely.

These data are derived from the VA, the Nation’s largest healthcare system. The VA system has unique features and actual amounts spent on direct and non-direct clinical care may differ from other healthcare systems. There may be aspects of administrative costs that are unique to the VA system, although it is very likely there is applicability of these findings to other healthcare systems. 

A major weakness of these data is that it is self reported. Data reported to central reporting agencies may be confusing with overlapping cost centers. Furthermore, personnel or other costs might be assigned to inappropriate cost centers in order to meet certain administrative goals. For example, 5 nurses and 1 PhD scientist were assigned to the pulmonary clinic at the Phoenix VA Medical Center while none performed any services in that clinic (Robbins RA, unpublished observations). These types of errors could lead to inaccurate or inappropriate conclusions after data analysis.

A second weakness is that the observational data reported in this manuscript are analyzed by correlation.  Correlation of decreased clinical care spending with increased mortality does not necessarily imply causation (13). For example, clinical costs are increased with readmission rates. However, readmission rates may also be higher with sicker patients who require readmission more frequently. The increased costs could simply represent the higher costs of caring for sicker patients.

A third weakness is that non-direct care costs are poorly defined by these databases. These costs likely include such essential services as support service personnel, building maintenance, food preparation, utilities, etc. but also include administrative costs. Which of these services account for variation in non-direct clinical costs is unknown. However, administrative efficiency is known to be poor and declining in the US, with increasing numbers of administrators leading to increasing administrative costs (14).

A number of strategies to control medical expenditures have been initiated, although these have almost invariably been directed at clinical costs. Programs designed to limit clinical expenditures such as utilization reviews of lab or X-ray expenditures or decreasing clinical MD or RN personnel have become frequent.  Even if costs are reduced, the present data imply that these programs may adversely affect patient mortality, suggesting that caution in limiting clinical expenses are needed. In addition, programs have been initiated to reduce both OMELOS and readmission rates. Since neither costs nor mortality correlate with OMELOS, these data imply that programs focusing on reducing OMELOS are unlikely to be successful in improving mortality or in reducing costs.

Non-direct patient care costs accounted for nearly half of the total healthcare costs in this study. It is unknown which cost centers account for variability in non-clinical areas. Since non-direct care costs do not correlate with outcomes, focus on administrative efficiency could be a reasonable performance measure to reduce costs. Such a performance measure has been developed by the Inpatient and Evaluation Center at the VA (15). This or similar measures should be available to policymakers to provide better care at lower costs and to incentivize administrators to adopt practices that lead to increased efficiency.

References

  1. Needleman J, Buerhaus P, Mattke S, Stewart M, Zelevinsky K. Nurse-staffing levels and the quality of care in hospitals. N Engl J Med 2002;346:1715-22.
  2. Aiken LH, Clarke SP, Sloane DM, Sochalski J, Silber JH. Hospital nurse staffing and patient mortality, nurse burnout, and job dissatisfaction. JAMA 2002;288:1987-93.
  3. Aiken LH, Cimiotti JP, Sloane DM, Smith HL, Flynn L, Neff DF. Effects of nurse staffing and nurse education on patient deaths in hospitals with different nurse work environments. Med Care 2011;49:1047-53.
  4. Diya L, Van den Heede K, Sermeus W, Lesaffre E. The relationship between in-hospital mortality, readmission into the intensive care nursing unit and/or operating theatre and nurse staffing levels. J Adv Nurs 2011 Aug 25. doi: 10.1111/j.1365-2648.2011.05812.x. [Epub ahead of print]
  5. Cho SH, Hwang JH, Kim J. Nurse staffing and patient mortality in intensive care units. Nurs Res 2008;57:322-30.
  6. Volpp KG, Rosen AK, Rosenbaum PR, Romano PS, Even-Shoshan O, Canamucio A, Bellini L, Behringer T, Silber JH. Mortality among patients in VA hospitals in the first 2 years following ACGME resident duty hour reform. JAMA 2007;298:984-92.
  7. Lagu T, Rothberg MB, Nathanson BH, Pekow PS, Steingrub JS, Lindenauer PK. The relationship between hospital spending and mortality in patients with sepsis. Arch Intern Med 2011;171:292-9.
  8. Cleverley WO, Cleverley JO. Is there a cost associated with higher quality? Healthc Financ Manage 2011;65:96-102.
  9. Chen LM, Jha AK, Guterman S, Ridgway AB, Orav EJ, Epstein AM. Hospital cost of care, quality of care, and readmission rates: penny wise and pound foolish? Arch Intern Med 2010;170:340-6.
  10. Render ML, Almenoff P. The veterans health affairs experience in measuring and reporting inpatient mortality. In Mortality Measurement. February 2009. Agency for Healthcare Research and Quality, Rockville, MD. http://www.ahrq.gov/qual/mortality/VAMort.htm
  11. Jencks SF, Williams MV, Coleman EA. Rehospitalizations among patients in the Medicare fee-for-service program. N Engl J Med;360:1418-28.
  12. Render ML, Kim HM, Deddens J, Sivaganesin S, Welsh DE, Bickel K, Freyberg R, Timmons S, Johnston J, Connors AF Jr, Wagner D, Hofer TP. Variation in outcomes in Veterans Affairs intensive care units with a computerized severity measure. Crit Care Med 2005;33:930-9.
  13. Aldrich J. Correlations genuine and spurious in Pearson and Yule. Statistical Science 1995;10:364-76.
  14. Woolhandler S, Campbell T, Himmelstein DU. Health care administration in the United States and Canada: micromanagement, macro costs. Int J Health Serv. 2004;34:65-78.
  15. Gao J, Moran E, Almenoff PL, Render ML, Campbell J, Jha AK. Variations in efficiency and the relationship to quality of care in the Veterans health system. Health Aff (Millwood) 2011;30:655-63.

Click here for Appendix 1.

Reference as: Robbins RA, Gerkin R, Singarajah CU. Correlation between patient outcomes and clinical costs in the va healthcare system. Southwest J Pulm Crit Care 2012;4:94-100. (Click here for a PDF version)